How to create a project management dashboard?

The project management dashboard: why and for which objectives?
- To avoid the numerous pitfalls of project management
43% of projects end up outside of objectives. That's almost half! And it is not a hazard. It is very difficult to manage a project successfully because many pitfalls make management complex throughout the project. The causes of failure of a project can be caused by many factors: costs are higher than those of the budget, communication problems set in, lack of visibility on the load extends deadlines, objectives lack clarity from management...
You can find more details on the main causes of project failure
The most effective way to avoid project failure is to monitor it effectively, from its start and regularly until its completion.
- To be able to see and share the project situation
This monitoring must make it possible to identify possible risks of failure throughout the project in order to carry out corrective actions as soon as possible. Monitoring allows you to be alerted when a risk materializes and to understand where the risk comes from.
It is also an instrument of communication. It allows all project stakeholders to be informed sufficiently in advance to streamline decisions and avoid unpleasant surprises. The more a problem is communicated upstream, the higher the chances of finding a solution. No one wants to have unpleasant surprises at the end of a project, and this is how well-executed project monitoring allows you to fulfill this role as a communication tool.
- To empower stakeholders
For a project to be successful, responsibility must be shared. Responsibility for tasks must be distributed to the different project stakeholders. Distributing responsibility involves appointing a person responsible for each task and clarifying the objectives: achievement, quality and deadline. The project manager then becomes the conductor who helps the entire team move forward, and who streamlines the exchanges so that everything takes shape. If stakeholders are not held accountable, the burden will be too heavy for a single project manager, and the risks of failure will be greater.
- It allows for clear communication that is understood by everyone.
The project monitoring table must make it possible to share the project situation at a given date, with information that is clear and understood by everyone.
Everyone must be able to understand how the project is going in the blink of an eye. That topics that are progressing well can be celebrated, and those that need correction can be identified and prioritized.
Following a project in a table format allows everyone to recognize an identical format from one period to another. It brings efficiency to the exchanges between the different stakeholders of the project and allows a situation to be documented clearly.
- To improve performance: respect for deadlines, quality, profitability
The project dashboard is also intended to keep the project aligned with the objectives. Depending on the priorities, different objectives are set:
-
- Respect of deadlines for the different phases of the project
- Expected quality level and potential customer validation
- Level of project costs that must remain aligned with the project budget
The dashboard compares the situation to date, the forecast situation at the end of the project, and the budget for these different objectives.
Noticing possible risks of deviating from objectives, project managers take the necessary corrective actions: restructuring project tasks to shorten it, renegotiation with the client, reallocation of tasks to improve efficiency, etc.
What KPIs should be included in a project dashboard?
Set priorities: deadline, quality, profitability? To define the KPIs to be integrated into the project dashboard, you must first determine the priorities with the project sponsors. Although it is possible to monitor numerous KPIs, we must avoid falling into systematic monitoring of all indicators. We must focus on KPIs that align with the priorities determined with the project sponsors. It is therefore necessary to determine whether the priority lies more in:
- Respect of deadlines : tasks and sub-tasks must respect specified deadlines and any overrun presents a risk for the project. KPI : show a progress rate and a number of days remaining before the deadline
- Compliance with an expected level of quality : the various tasks must be controlled and rated according to expectations in terms of quality. The project dashboard should display the achieved score vs the expected score. KPI : show a quality score for each task and a comparison with the expected
- Profitability : project costs must fit within a certain envelope set by a project budget. KPI : show the costs of the project which take into account what has been achieved and what remains to be done, and compare it to the budget
Here is our selection of KPIs for project monitoring .
Proactive forecast project monitoring in Stafiz
Stafiz allows real-time, forecast monitoring of all your resources and their associated costs: resource planning , subcontracting, purchases, recipes… You are alerted in the event of a future deviation.
What is a project tracking table? Who benefits?
What does a project monitoring table look like?
Two types of approaches that can be combined: by tasks and by gantt. The two approaches can be mixed to provide a complete view. If tracking deadlines and linking tasks to each other are important, the Gantt approach should be preferred. If, on the contrary, each task can be carried out in a generally independent manner, then a table by tasks makes it possible to reflect the situation clearly.
- By tasks
The project monitoring dashboard by tasks lists all the tasks and sub-tasks, and on each of them, provides indicators allowing you to know the situation and performance. On each task line and sub-task a manager is appointed, so that the objectives are clearly assigned to a defined person.
Ideally the dashboard is updated with the information available or reported by the various managers before the meeting to share the situation. During the meeting, each manager can share with the other participants the status of the task and provide details on specific indicators.
To find out more, see our article on task planning.
- In Gantt
The Gantt format is more oriented around the duration of the task or subtask. This approach focuses particularly on deadlines: when will the task start and when should it finish. The Gantt approach also makes it possible to specify the links between the different tasks. In fact, it sometimes becomes necessary to complete one action in order to begin another. Visibility into the links between the different tasks helps prevent a bottleneck from being created and delaying the entire project.
What exactly does the project monitoring table contain? When should you launch it?
-
- Project monitoring must start from the start of the project
The project monitoring table must be shared from the start of the project. During the kick-off meeting, it is important to share this project monitoring table and explain it to all participants so that everyone is aligned.
The project manager must verify that all indicators are understood. It must also ensure that sponsors confirm that they adhere to the indicators it contains. The wider and stronger the support at the start of the project, the more invested the stakeholders will be in achieving the set objectives. This step of sharing the project monitoring table is therefore crucial for the success of the project.
-
- KPIs, deadlines, managers
The project monitoring table must also systematically include the following information:
-
-
- Responsible : for each task and sub-task, a responsible person must be determined. Each manager must know the tasks for which he is responsible and in return be able to indicate how they are progressing. Some tools allow you to indicate a percentage of progress, for example. It must also be able to indicate what remains to be done for the associated load to be updated.
-
-
-
- Deadlines : To ensure that the project is completed on time, deadlines must be set for each phase and task of the project. This is a commitment that must also be confirmed at the start of the project. The manager must confirm the feasibility of the task within the deadline objectives.
-
-
-
- KPIs : they must adapt according to the task. The objective can be a number of hours or days not to be exceeded (when we wish to control profitability), or a number of deliverables to produce or even a quality “score” provided by the client. As indicated earlier in this article, the choice of KPIs to follow must be perfectly aligned with the objectives of the sponsors.
-
Who should update the project monitoring table? How do I share updates?
-
- Bring back information to consolidate it
It is the project manager who is responsible for updating the project monitoring table. But to be able to consolidate the information, each task manager must be up to date in their monitoring. Ideally the information is updated in the same file and consolidates automatically. The project manager checks that the data is consistent and, if necessary, questions the various task managers to ensure overall visibility.
It is also at the time of this feedback that the remaining amounts must be calculated. When tasks are not completed, indicate the time required to finalize them. This allows the project manager to update the overall project schedule and recalculate the project's forecast margins.
How to create a project management dashboard?
Should this be done on a spreadsheet or using a dedicated tool? We will now describe in more detail the methods for creating a project monitoring table.
Create your dashboard: the project monitoring table must allow you to take the temperature of the project at any time. It must therefore provide all the information at a glance to know the health of the project. It must provide information on operational, analytical and strategic subjects.
-
Operational dashboard
The project monitoring table must provide operational information in the first place. That is, it must indicate the time remaining to finalize the various project tasks and the associated burden for the people working to complete these tasks.
This remaining work should make it possible to adjust the capacity of the collaborators working on the project. By indicating, for example, that they have eight hours left to spend on a task for next Monday, the equivalent capacity to work on other tasks must be adjusted so that it is zero.
At the same time, monitoring should display the progress of the project and project tasks. Several possibilities for displaying progress: a percentage, a more visual progress bar, etc. whatever the solution chosen, it must make it easy to see whether or not we are close to completing the task.
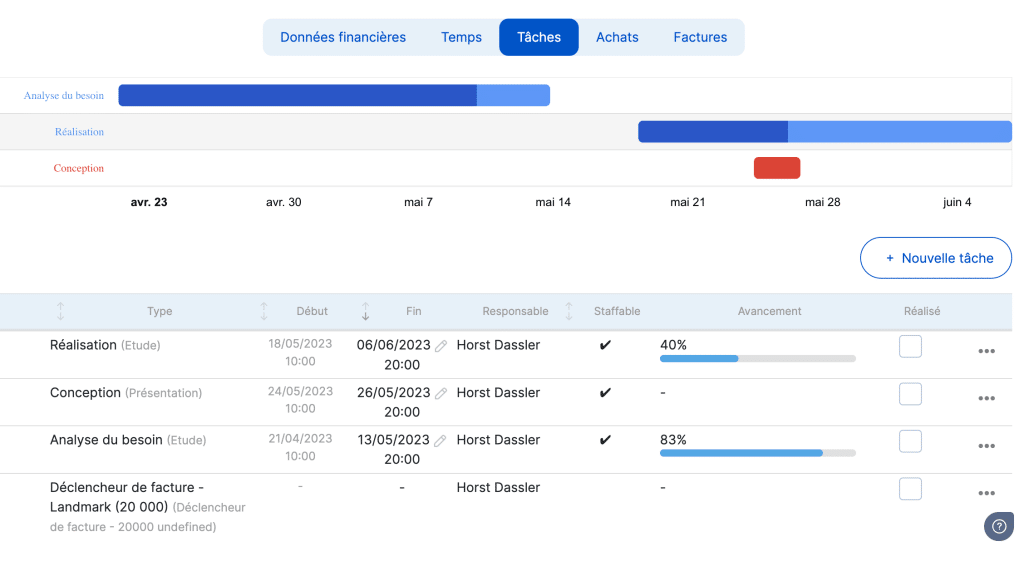
Beyond the progress of a task, if the planning approach makes sense, it is interesting to indicate when the task will be completed. Either by indicating a planned end date in the project monitoring table. Either by displaying it in a schedule in a Gantt format.
-
Analytical dashboard
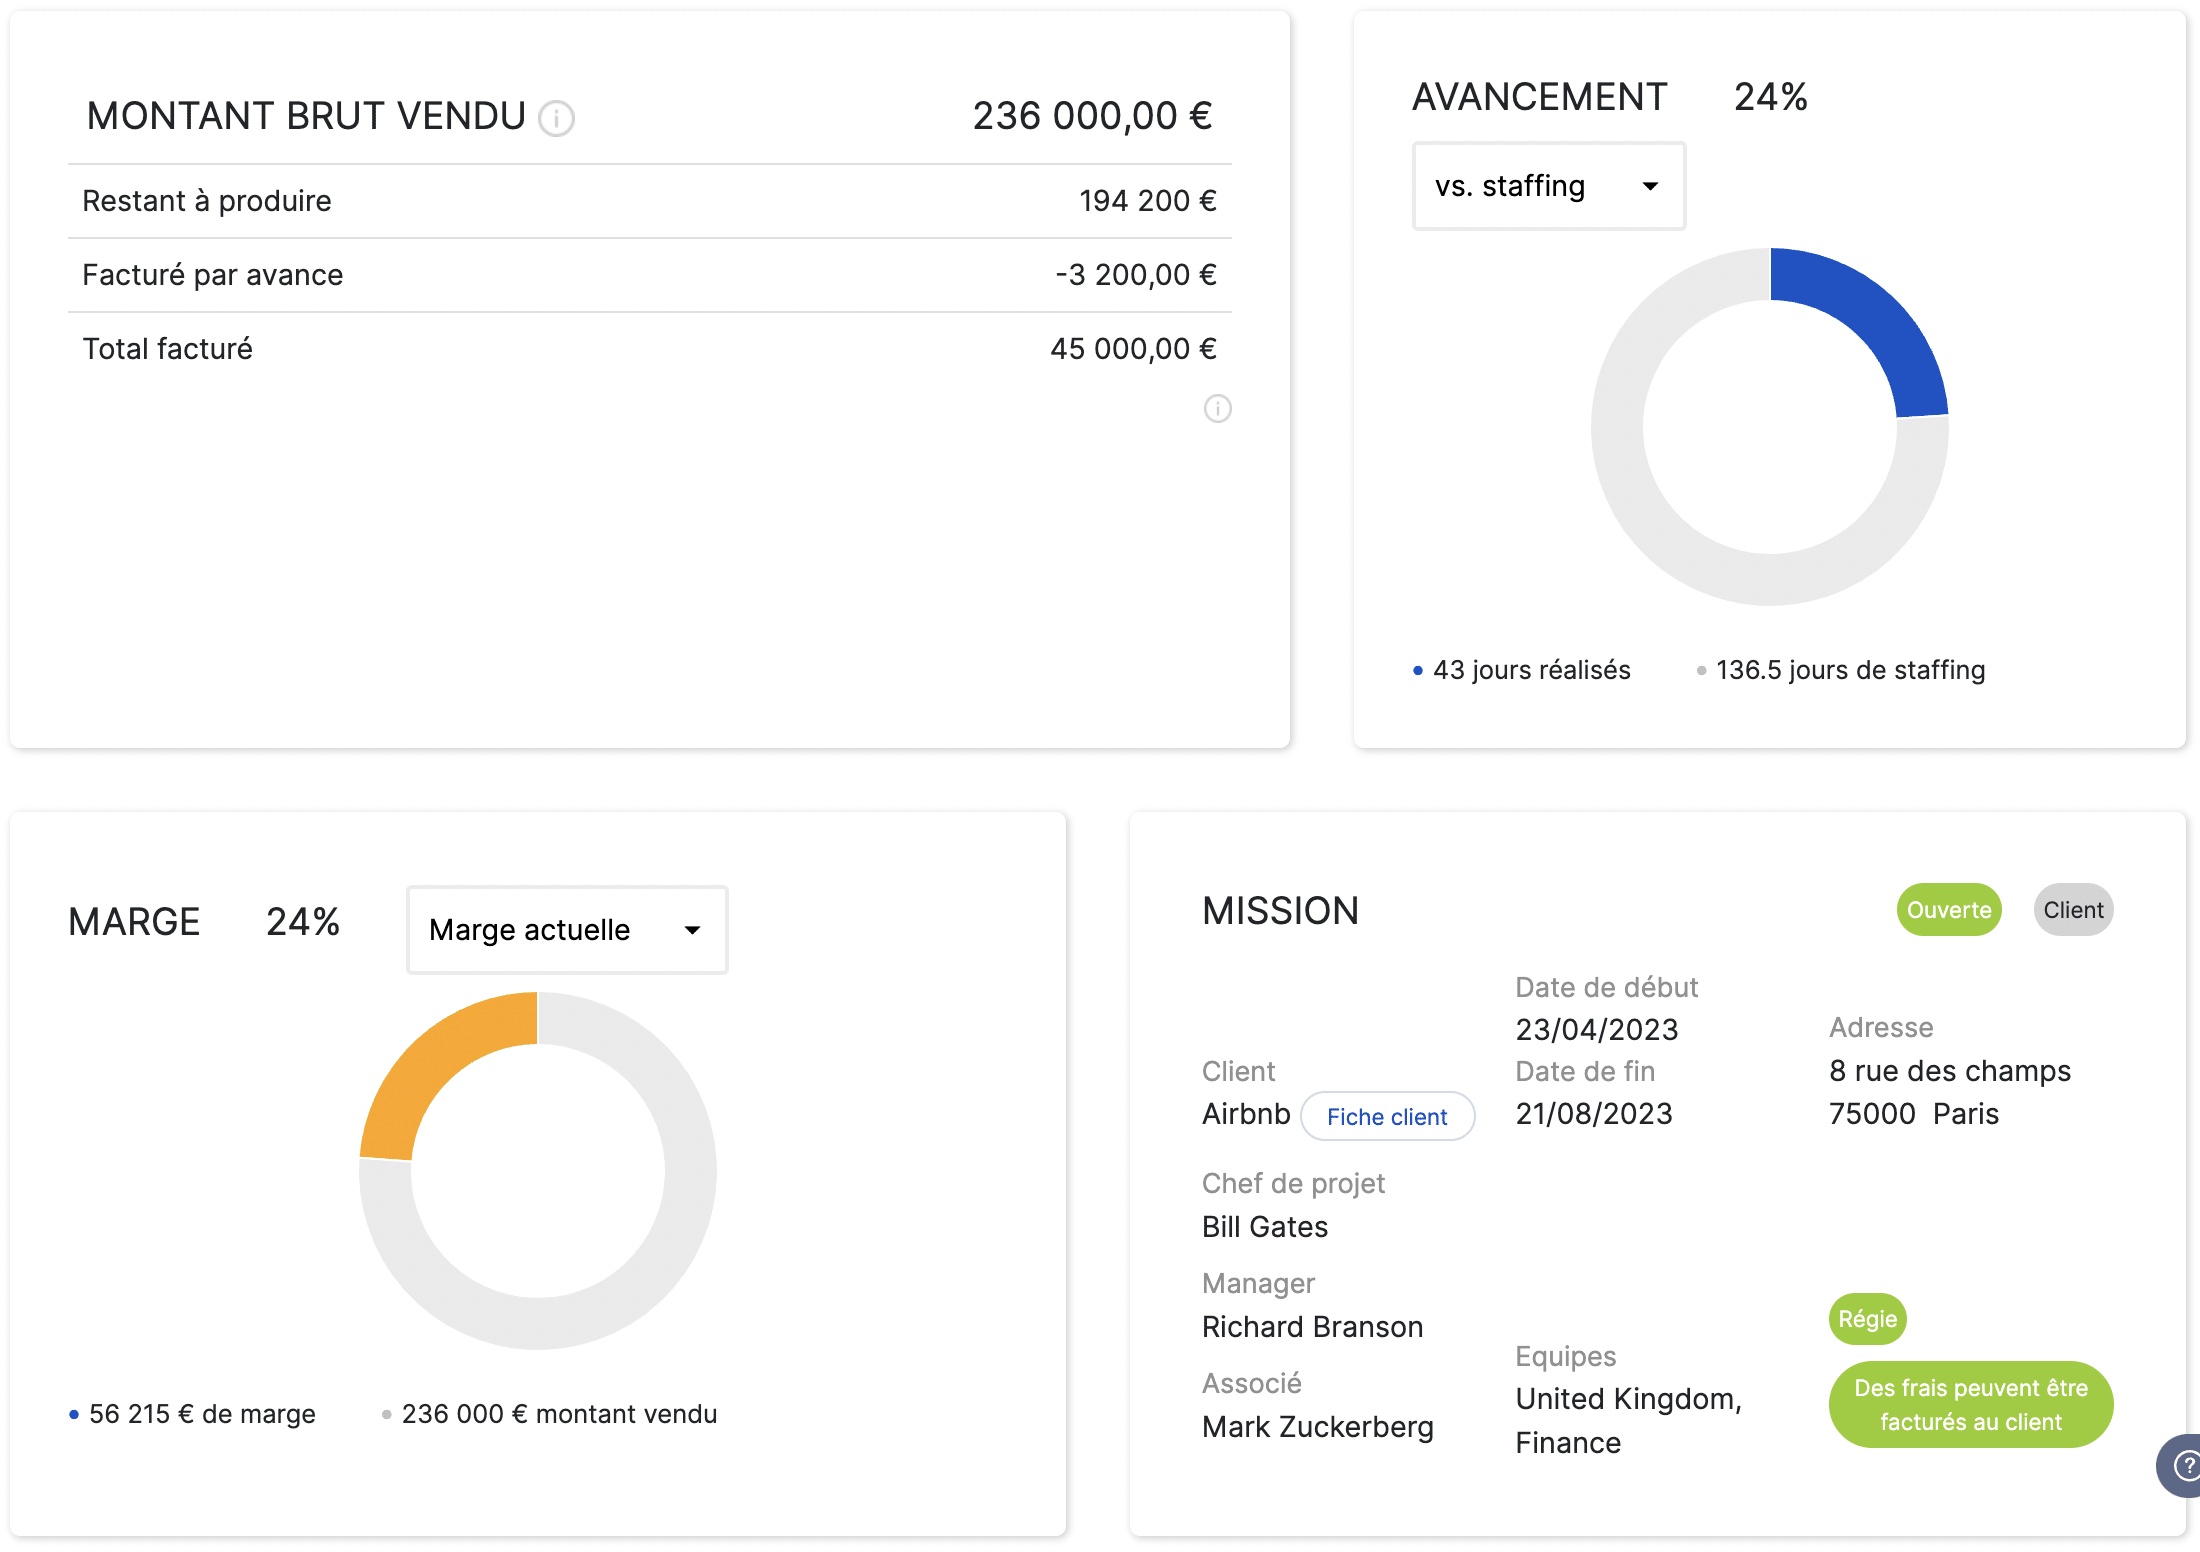
The project monitoring table must then provide a performance analysis. Displaying major key performance indicators allows you to take the temperature of the project, but you need to go further to understand the reasons for overperformance or underperformance.
For example, you must display the differences between the overall objective compared to the last estimate and give the same information with detail task by task or manager by manager. This allows us to understand where the discrepancies come from and what their causes may be.
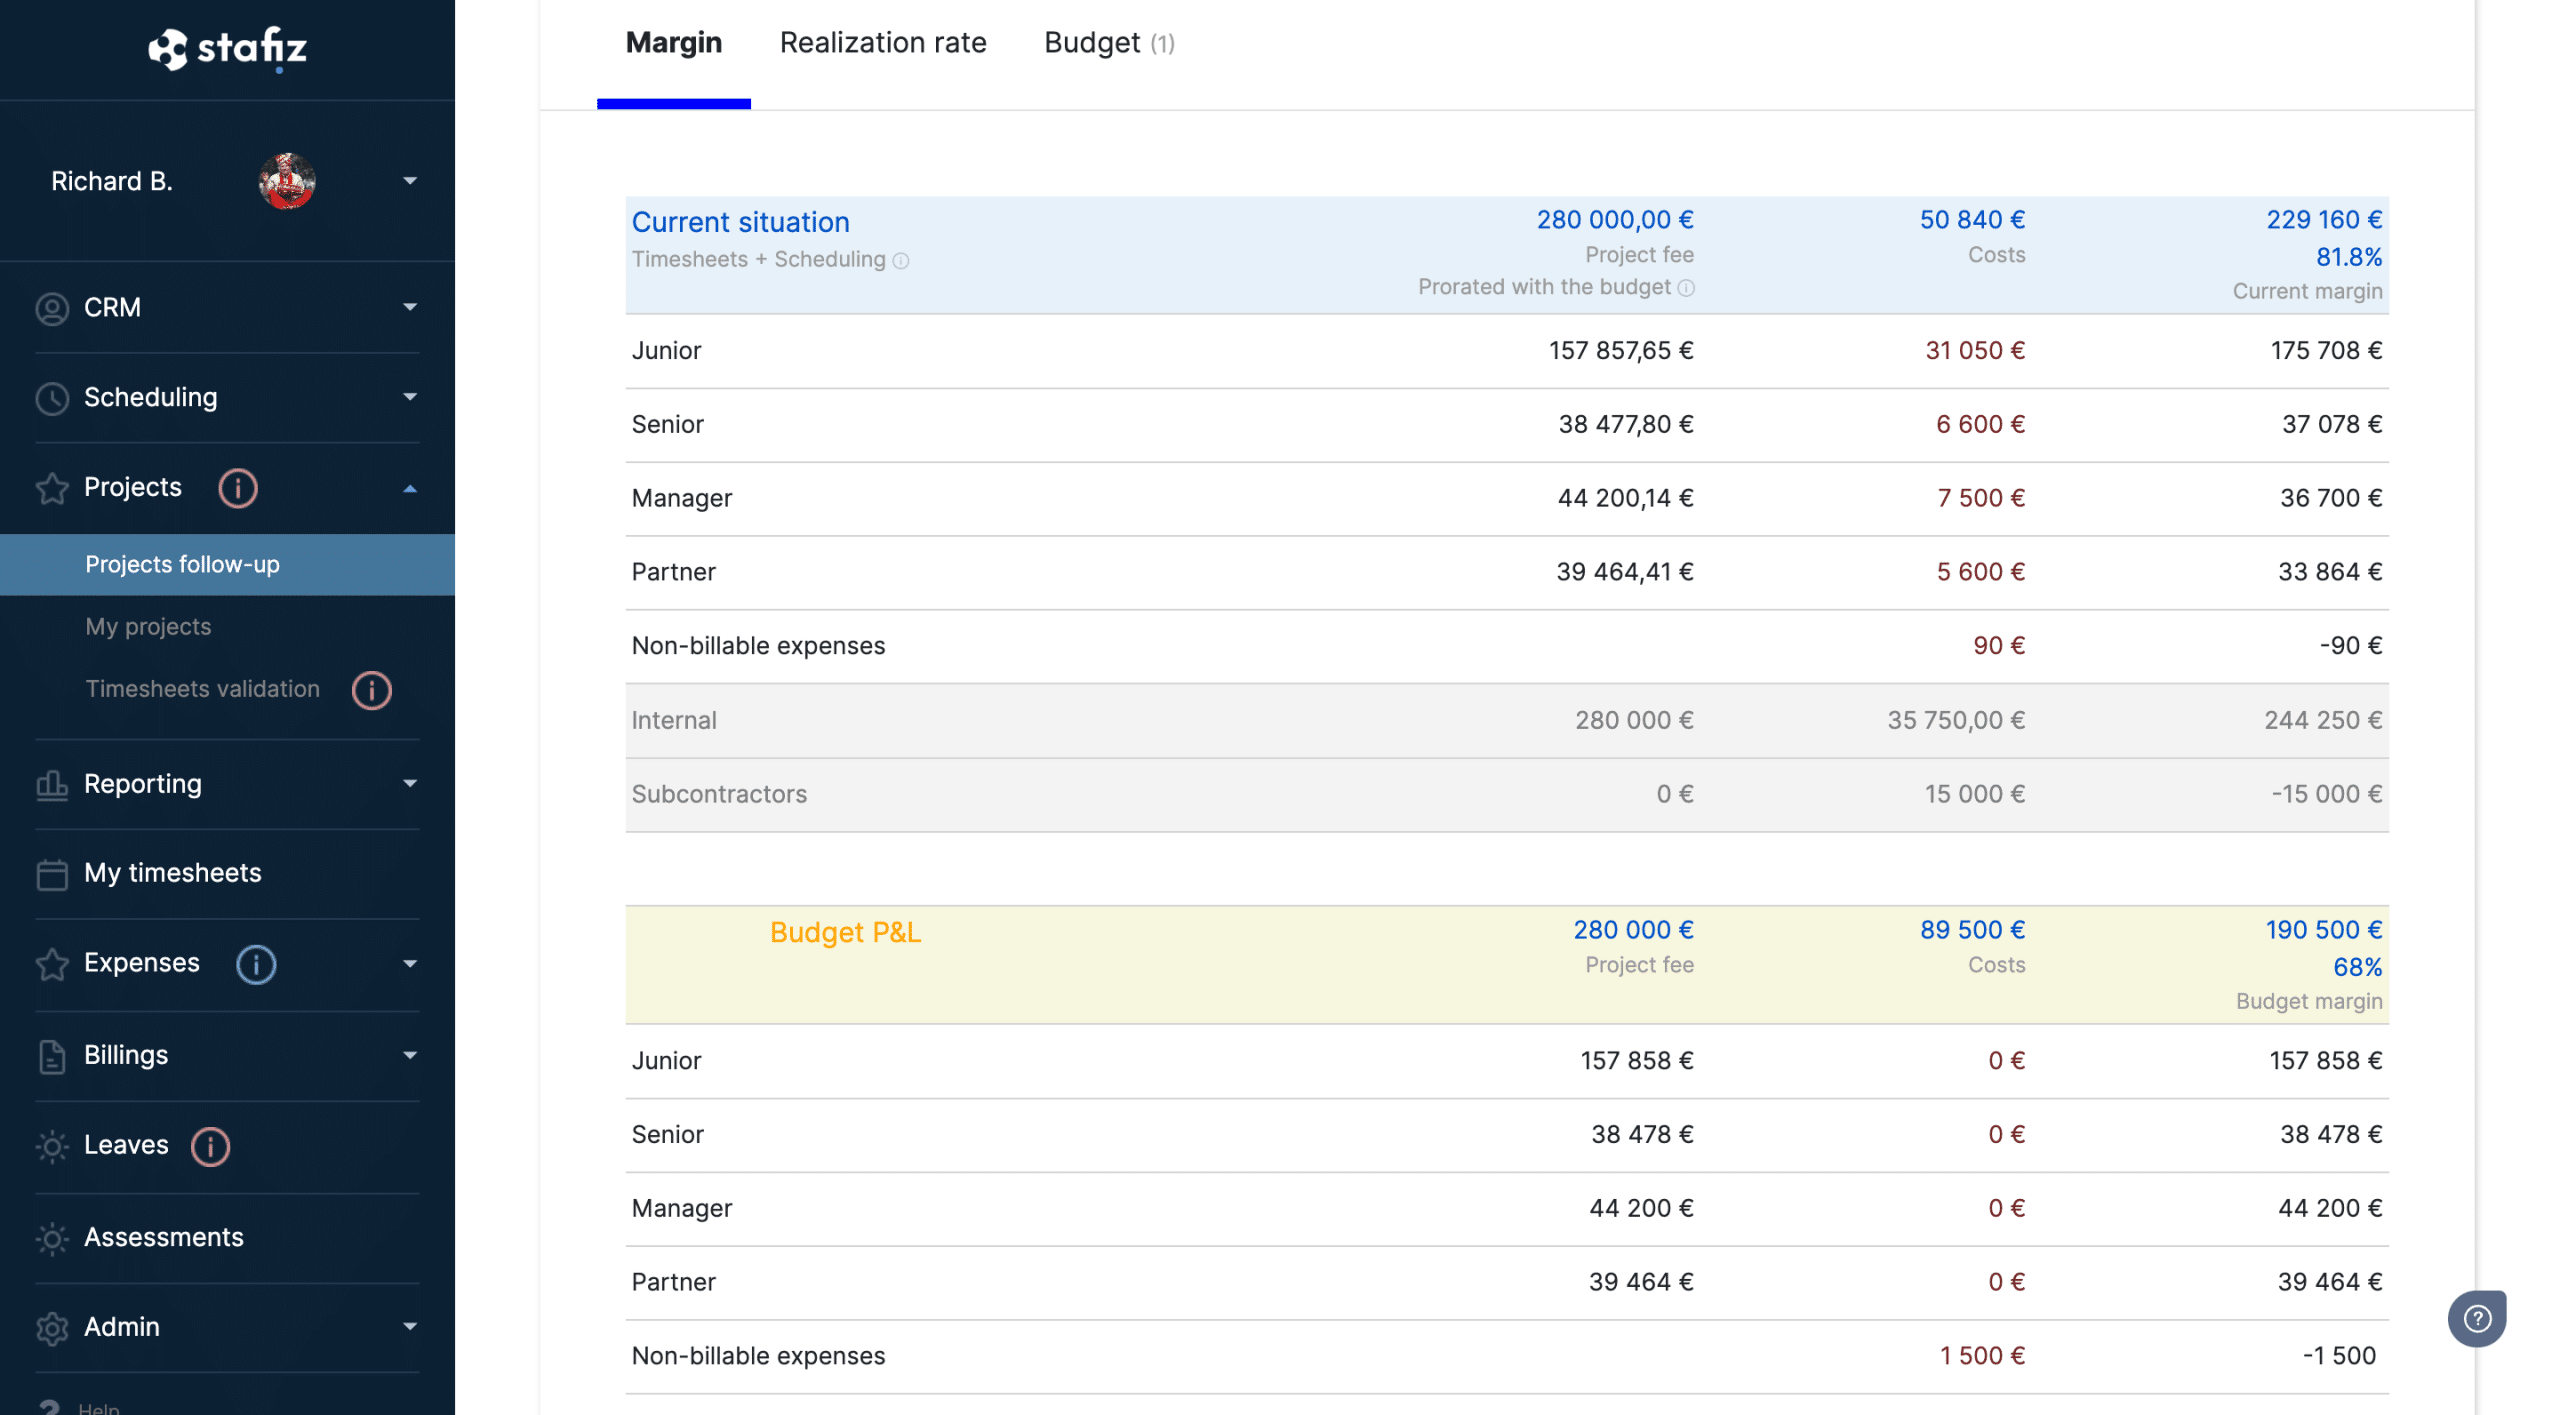
Analysis of gaps between the initial plan and reality – Analysis by profile type
A comparison of the project's performance compared to other similar projects also provides an interesting analysis. Next to the project indicators, display an average indicator for similar projects to compare performance.
-
Strategic dashboard
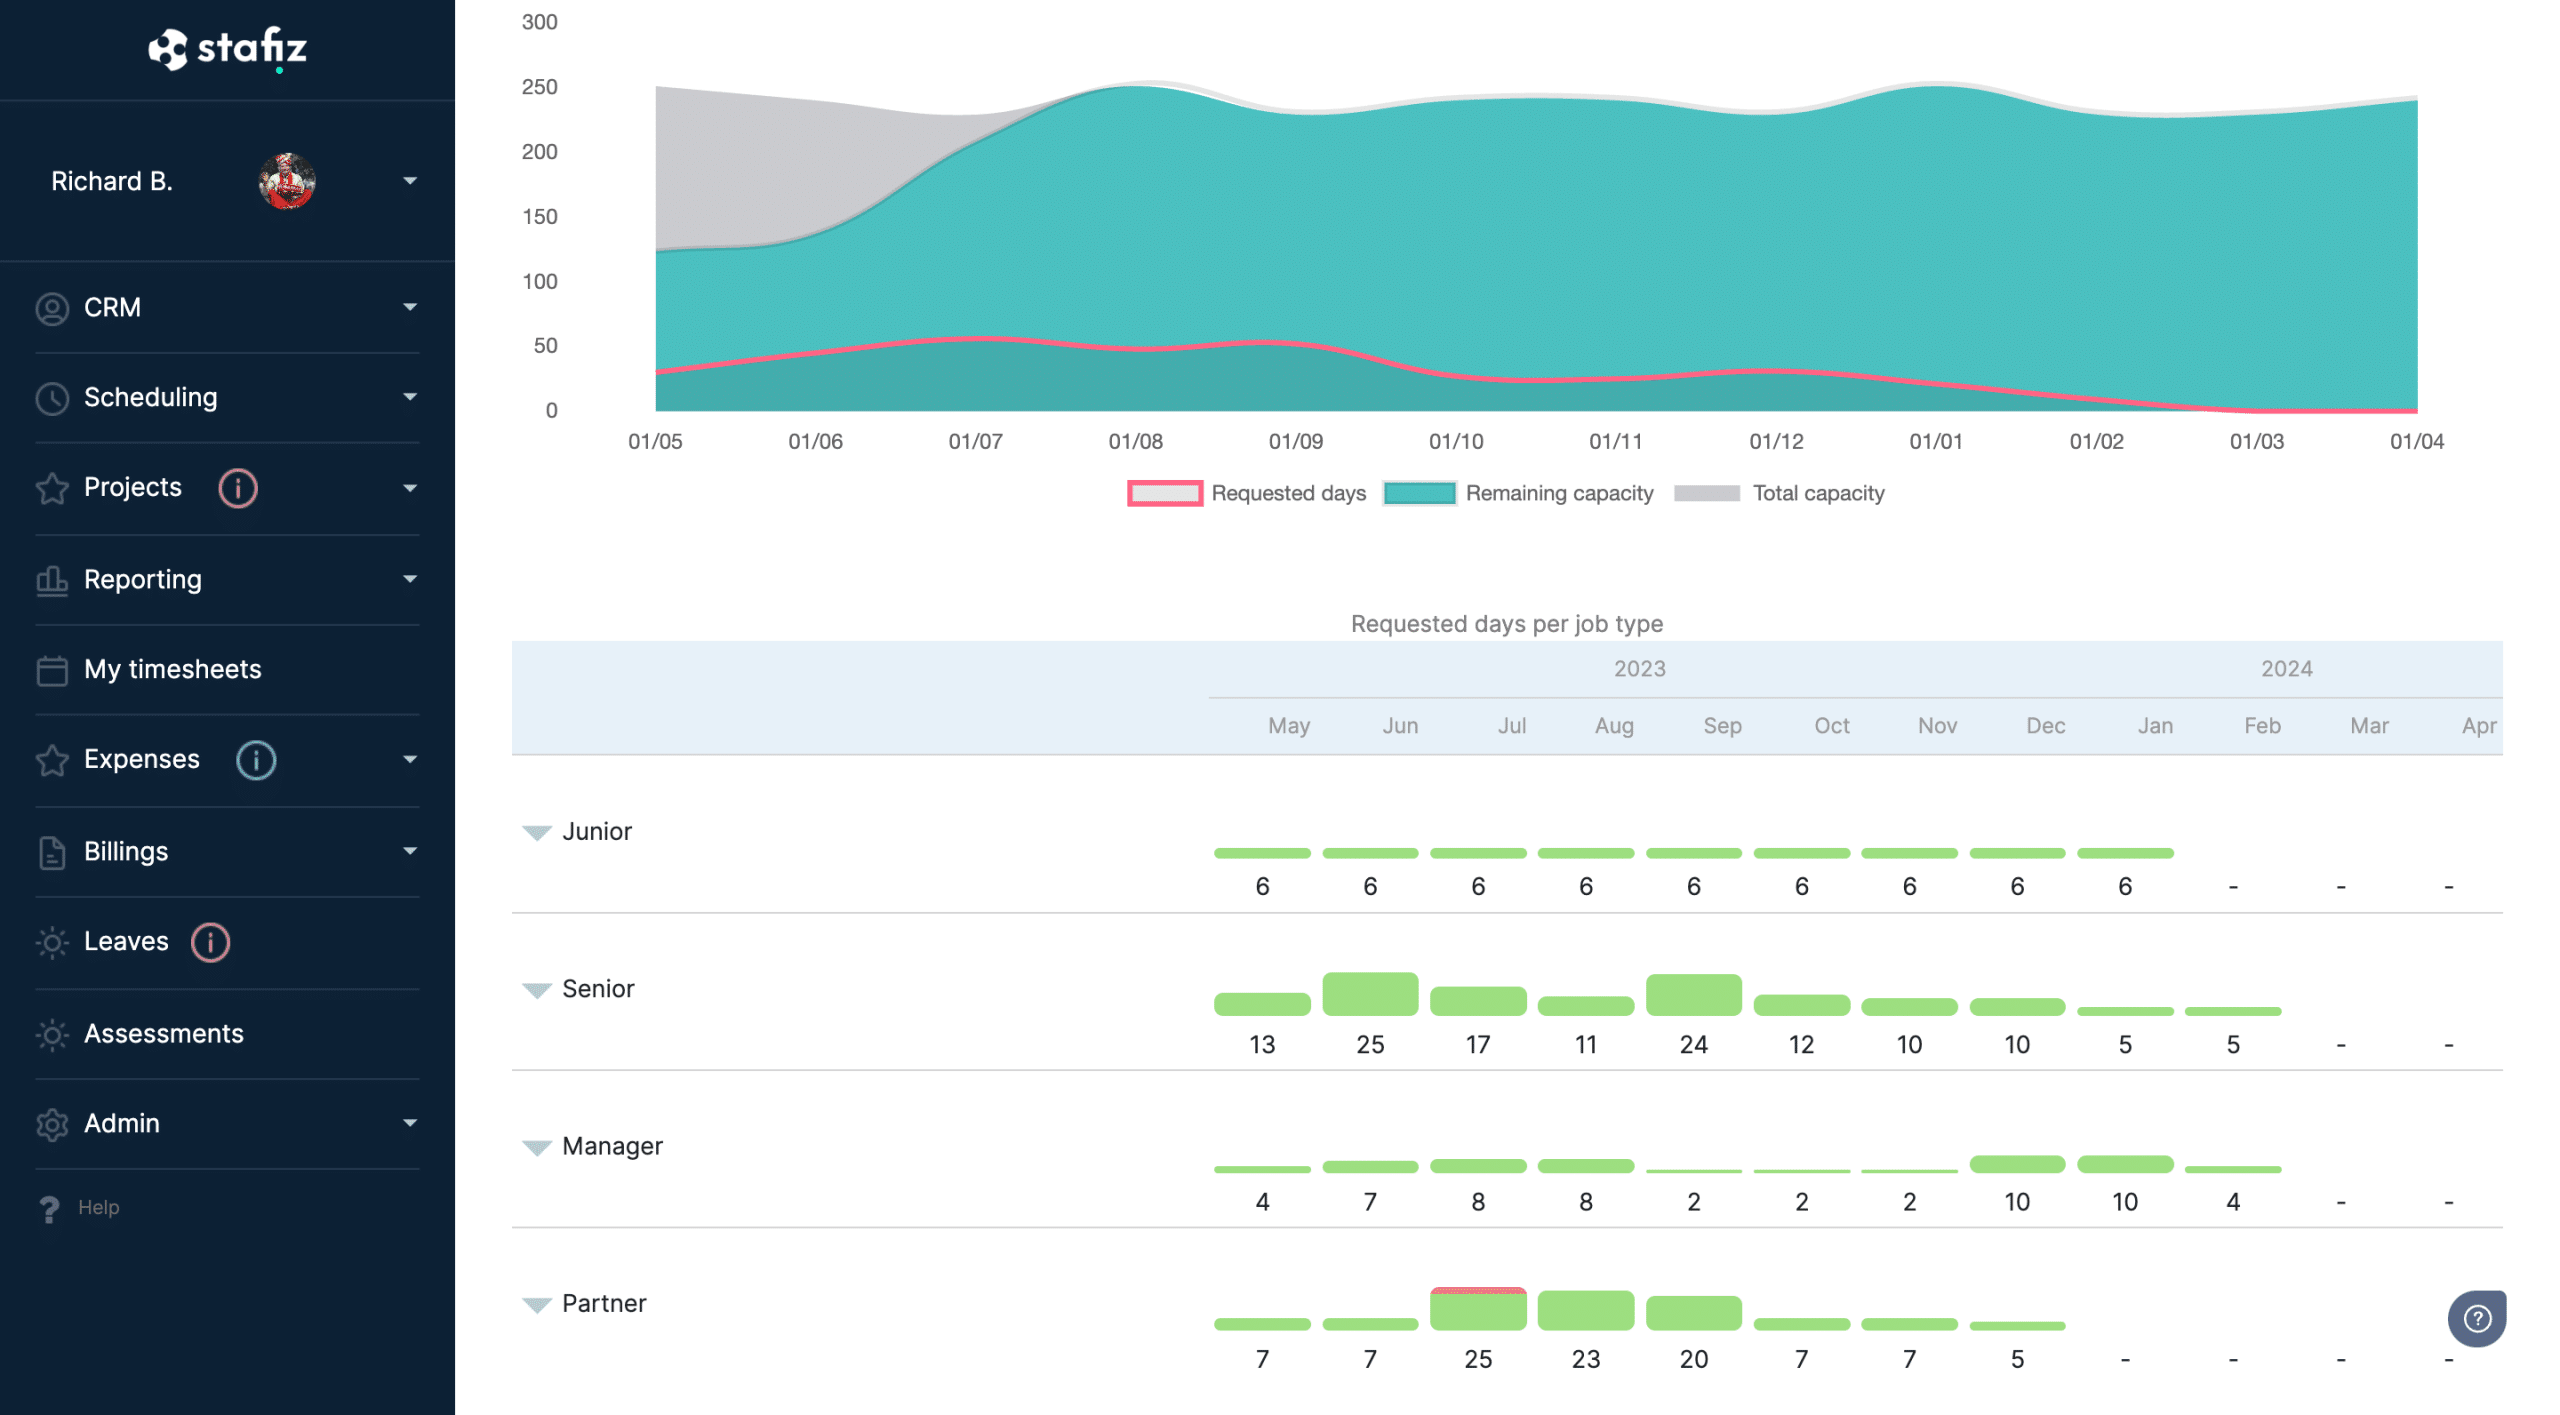
By consolidating the different project monitoring tables, it is possible to provide strategic information that helps make better decisions at the company level.
By consolidating the planned load on the different projects, it is possible to have a complete view of the team's load. Know who is overstaffed or understaffed. This information makes it possible to optimize the overall workload and to know whether it is necessary to recruit certain profiles who will be under capacity in the future.
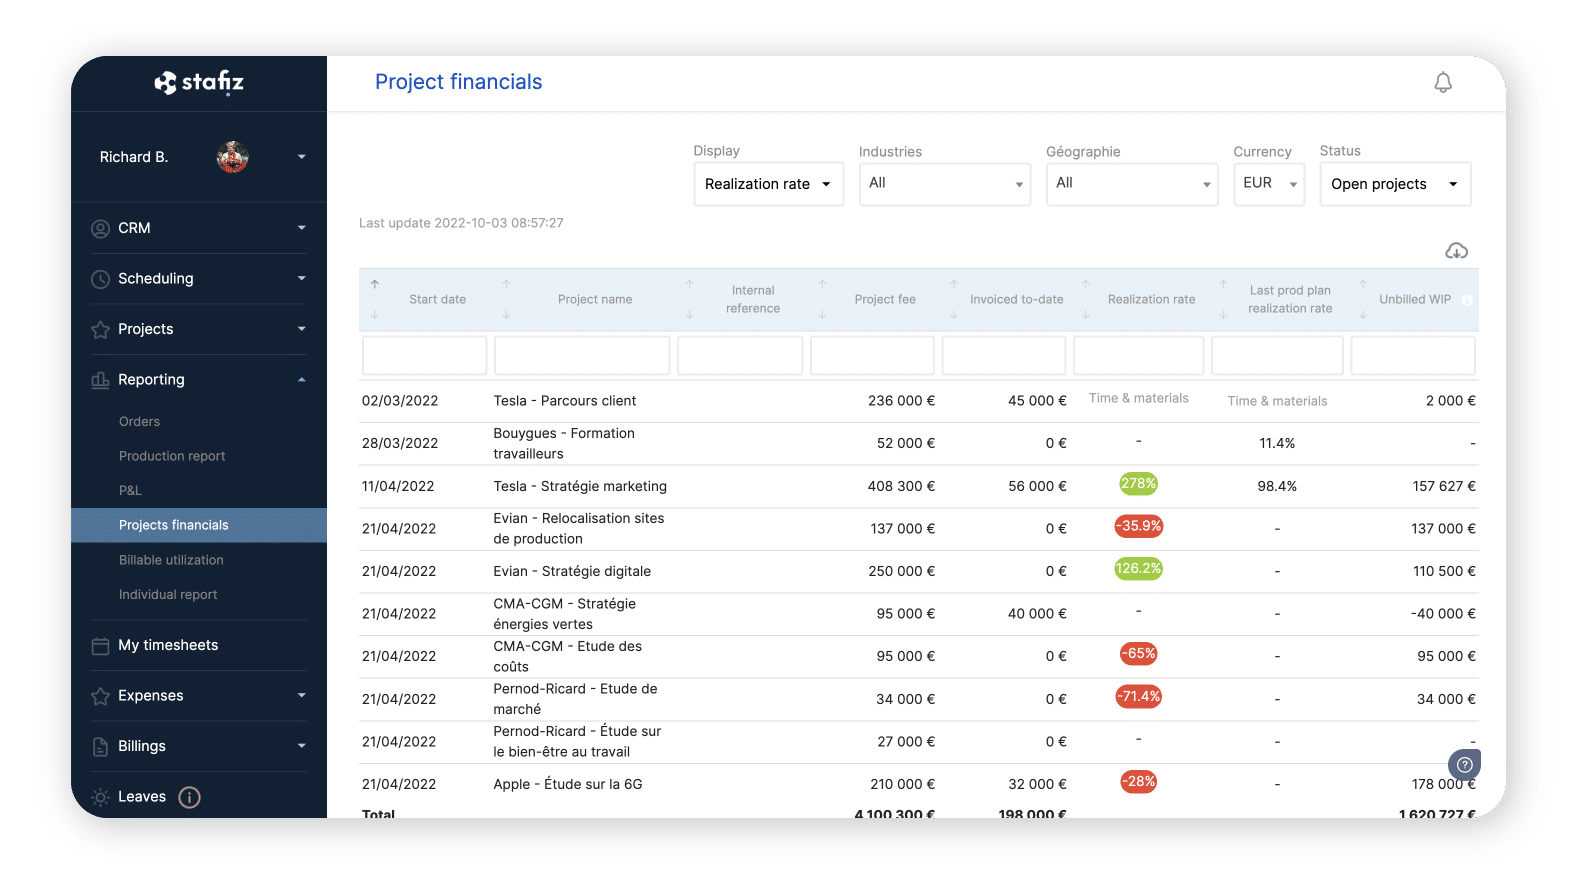
The financial data of the project and its progress make it possible to calculate the turnover and margins that will be generated in the months to come. Consolidation makes it possible to put forward an income statement for the entire activity.
By comparing the different project monitoring, it is possible to identify interesting trends: which tasks most often lead to underperformance? what is the deviation rate from the average budget? Statistics make it possible to better prepare and cost projects in the future and improve margins.
To learn more about project monitoring, consult our guide.
Limits to using Excel files for project monitoring
The most frequent limitations to using Excel to create project monitoring tables are as follows:
| Excel | Dedicated tool | |
|---|---|---|
| Teamwork | Difficulty working with several people at the same time on the file | Concurrent connections and actions. Sending workflows and notifications. |
| Maintenance | Problem of managing a complex file. Creator-related maintenance | Maintenance supported by the publisher. Ensure licenses offer rolling maintenance |
| Agility of views | Big. Excel still provides a lot of flexibility but it is the last save that determines the view | Views and analysis angles can be saved so that each user can find their preferences |
| Time saving | Excel does not always allow you to automate actions. It is therefore not uncommon for its use to result in double entry. | Dedicated tools allow processes to be connected to each other via API, for example. Which avoids double entries |