
Updated May 12, 2026
In short: to manage the profitability of a project in a firm or in IT Services, three families of indicators frame the day-to-day work: the margin (forecast, at completion, progress), the resource planning (utilization rate, occupancy rate, intercontract) and commercial management (projected turnover, flat-rate mix, invoicing). Corporate finance KPIs (WCR, solvency ratios) are not enough: they measure overall health, not profitability on a project-by-project basis. The 12 indicators below treat the project as a stand-alone economic unit, with its own alert thresholds.
Are you a project or a resource planning manager? Are you part of the PMO or in another project portfolio management role? If you are in charge of a team, you must surely realize that monitoring the performance, progress, workload and execution of projects in real time is far from simple.
There are numerous KPIs in project management . However, to reliably monitor the financial health of a project , it is important to consider the relevance of the performance indicators to be selected.
In this article, we introduce you to 12 indicators to monitor for reactive project financial monitoring.
🔎 What you need to know about the project's financial indicators
- The project is the real economic unit of a service company: the overall profitability is the sum of the project margins, not the other way around.
- Corporate finance KPIs (WCR, ratios) arrive 4 to 6 weeks late on project drifts: they do not manage the current margin, they see it.
- A useful project KPI brings together 4 ingredients : quantified objective, alert threshold, single manager, frequency aligned with the decision. The others are cosmetic reporting.
- The real-time forecast margin saves 90 days of arbitrage on a 4-month project compared to a monthly margin, and triggers the IFRS 15 provision as soon as the drift is known.
Why corporate finance KPIs are not enough in firms or in IT Services
Traditional financial indicators (working capital requirements, solvency ratio, cash flow from operations, break-even point) measure the overall financial health of a company over a period of time. They are produced by the administrative and financial department on a monthly or quarterly basis, based on the consolidated accounting entries.
In a service society, the project is the real economic unit. The profitability of the company is the sum of the margins of hundreds of projects, each with its own contingencies: a consultant replaced, a rewritten deliverable, a negotiated extension, a delay in signing a purchase order. An average consolidated margin of 18% at the enterprise level can mask half of projects with over-margin and half with deadweight loss.
Three blind spots appear as soon as we limit ourselves to corporate KPIs:
- The time it takes to escalate. A budget drift identified at the monthly close is already 4 to 6 weeks old. Over a 6-month project, one-sixth of the time available to correct has already been lost.
- The aggregation. An average profitability indicator says nothing about the distribution of margins by project, by client, by practice. The steering corrects averages, not projects.
- The granularity gap. A WCR measures the cash flow gap between customer receipts and supplier disbursements. It does not capture uninvoiced production, which can represent 15 to 30% of turnover in project activity.
The 12 indicators detailed below operate at the project level, on a daily or weekly basis, and then feed into the consolidated KPIs. It's the reverse order of traditional management control: we start from the project to the company, not the other way around.
Project Performance Indicators
Whether the project is internal or invoiced to a client, its management has a cost for the company.
To monitor the performance of a project, there are several metrics that provide visibility on the aspects of progress and good financial execution.
The Completion Rate
Often used in fixed-price projects, it relates the theoretical valuation of the time to be spent on the entire project to the valuation of the time consumed.

For example, if a project included a 10-day charge at €800 per day of ADR, but in reality the project took 12 days to complete, the completion rate is equal to 8000 / 9600 = 83.3%.
Formula. Completion rate = (hours sold / hours consumed) x 100. A value greater than 100% means that you have consumed more hours than the customer was billed to, and therefore eroded the expected margin.
Not to be confused with the percentage of advancement. The completion rate compares consumption to the time budget. The percentage of completion compares the work delivered to the planned work. A project can be 80% consumed and 50% advanced: this is the signal of a future drift.
- Completion Rate Goal
This indicator situates the actual performance of the project in relation to the budget. It is very interesting when it is a project sold at a fixed price and the sale price is directly related to the estimated load on the project.
Thus, when the selling price is decided, it is common to do so by calculating the time to spend making it and multiplying this time by the Average Daily Rate or ADR (if the unit is daylight).
In this case, the sale price can be determined with the following formula: (Time to spend on a project) * (Average Daily Rate (unit = day)).
- Challenge for project managers
The objective is to keep this number of days planned, or even to improve the organization. The project is then delivered at the same quality in less time than expected, or with more profitable employees. This adjustment is possible by reducing the senior profiles initially staffed on this project in favor of junior employees if the availability of resources allows it.
Under these conditions, the challenge is to continue to ensure customer satisfaction at least as high as with the originally planned plan.
- How to track the completion rate?
It is interesting to look at the completion rate at the end of the project by comparing it to what was initially planned. But it is also and above all during the course of the project that it takes on its usefulness, as an indicator of the projected performance of projects.
To do this, it is necessary to have established the budget, but above all to monitor what remains to be done in this project. It includes the time already completed on the project, as well as the time that remains to be produced to complete the work.
When resource planning employees are tracked, the data is already present to calculate this completion rate. Ideally, changes to resource planning will display an immediate reassessment of the completion rate, so that you can check the project's forecast performance and take corrective action before it's too late.
Stafiz is a project management tool that offers you more visibility on the workload of your employees, the progress of your projects and their profitability thanks to a complete real-time forecast reporting.
Budget monitoring of projects, in anticipation
See Stafiz in action in 2 minutes
Margin at Termination
The margin at completion is the projected margin of the project at its completion. The margin at completion takes into account the costs already spent on the project, regardless of their nature (subcontracting, resource planning, fees). It also includes future costs, to deduct them from the total projected turnover of the project.
Three notions to distinguish. The margin at completion estimates the expected final margin, based on the cost incurred plus the remaining cost to be done. The Estimate At Completion (CAT) (CAT) is the estimate of the total cost at the completion of the project. The loss at completion (PAT) is the anticipated recognition of a loss before the end of the contract, which must be the subject of a provision in accordance with IFRS 15 and the French General Accounting Plan (Article 322-3).
Formula. Margin at Completion = (Expected Revenue − Estimated Total Cost at Completion) / Projected Revenue.
When to provision. As soon as the estimated cost at completion exceeds the expected turnover, the loss should be recognized immediately, even if the project is still ongoing.
1. Identify the expected turnover
The expected turnover is the contracted turnover of the project, in a fixed-price, time-and-operated or mixed model.
2. Calculate the cost incurred
The cost incurred adds up the hours consumed valued at standard cost, purchases and subcontracting invoiced.
3. Estimate the value of the remaining work
The remaining value multiplies the remaining man-days by the standard internal cost per profile.
4. Apply the formula
Margin at completion = (Expected turnover − cost incurred − Valuation still to be done) / Forecasted turnover. The calculation must be updated every week to remain reliable.
- Margin to Completion's Goal
Margin monitoring at completion is essential for several reasons.
First, to ensure that the projected margin of a project is not negative. Beyond the aspect of good management which encourages ensuring that projects end with a positive margin, this verification is mandatory for accounting in order to be able to pass from provisions for losses to completion if necessary.
Monitoring margins at completion strengthens cost management. There are many levers to improve the margin of a project: re-organizing the resource planning, reduce anticipated travel costs, pick up an additional order, and more.
- How to monitor this indicator?
To reliably monitor the margins at completion, it is necessary to re-estimate your projected turnover, but above all to be able to establish a forecast of future costs.
It is generally the role of the project manager to calculate the initial budget and then to re-estimate, during the course of the projects, all of these costs of resource planning, subcontracting, fees, purchases and any other additional costs.
It is strongly recommended to carry out regular reviews of all projects to identify those that deviate from the budgeted margin in order to carry out corrective actions as quickly as possible.
Production carried out without invoicing
More useful in a project under control (invoiced by time spent), this metric measures the production carried out (in value or time) that has not yet been invoiced to the client.
For the value calculation, the number of time units already spent on the project is multiplied by the applicable billing rate, for example an Average Daily Rate. The resulting value is then compared to the amounts invoiced on the same date.
Its formula: (Number of units of time spent on a project) × (Billing rate applicable to this unit).
Definition. Uninvoiced Completed Production (also known as Work In Progress or WIP) is the value of work delivered to the customer but not yet invoiced. It is recorded on the assets side of the balance sheet under account 33 "Work in progress of production of goods and services" according to the CCP.
Why follow her. A high uninvoiced production indicates either an administrative delay (pending purchase order, untriggered milestone invoicing), or a discrepancy between the actual progress and the contractual invoicing rate. In both cases, it drains the cash flow.
Tracking of uninvoiced production and percentage of completion
- Purpose of tracking uninvoiced production
Knowing the value of the production carried out without invoicing reinforces the control of cash flow. Regardless of the payment terms, this represents cash that can be recovered in the short term. Of course, it is not always possible to invoice this production immediately according to the deadlines agreed with the customer. However, it is an excellent indicator of future cash flow, especially when it is looked at in a consolidated manner.
- How to monitor this indicator?
An integrated solution simplifies the monitoring of this indicator. It centralizes the time spent on a project, the Average Daily Rates (or Average Hourly Rates) assigned to each resource, and invoicing. These three elements feed into the calculation.
A review of the uninvoiced realizations by division or overall makes it possible to analyze good practices in terms of invoicing.
Progress Percentage
This indicator gives the progress status of a project. Progress can be analyzed with the unit of time or if the project is associated with a turnover with the unit of value.
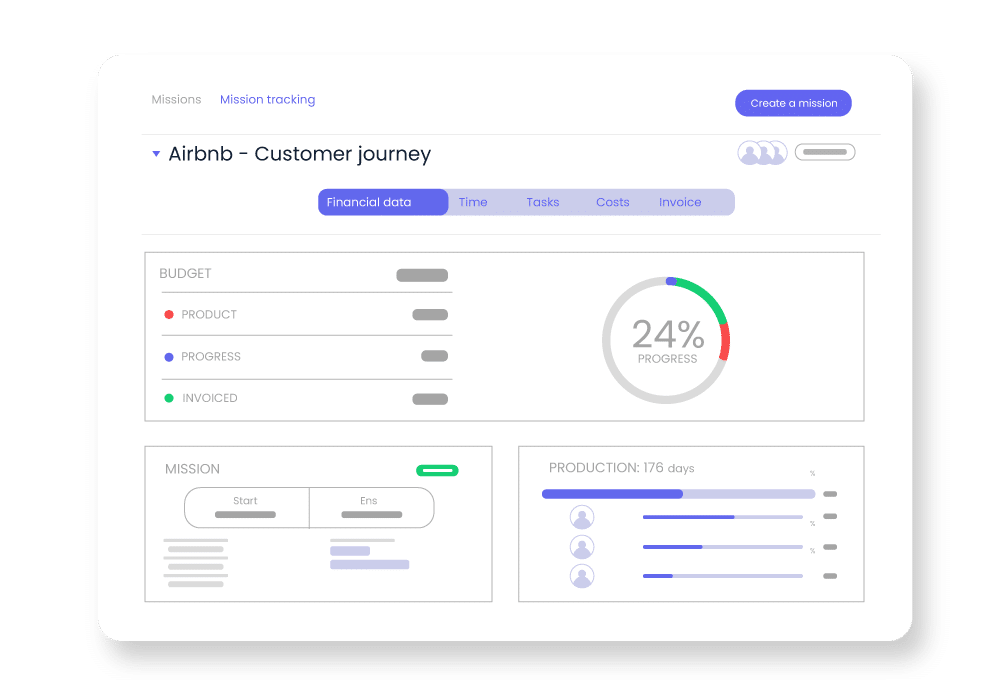
Tracking of uninvoiced completed production and percentage of completion in Stafiz
This percentage of progress can also be analysed in relation to the initial budget or in relation to the last estimate. When your management tool calculates a turnover at the time of progress, it is also possible to know the progress as a percentage of the turnover.

- Progress Percentage Goals
It is important to track the percentage of completion to ensure that objectives are met. Completing deliverables on time is a major objective of project management.
This target is also often analyzed in conjunction with another metric, On-Time-Delivery, which calculates the number of projects completed on time as a proportion of total projects. The project manager must therefore always keep a close eye on this important project management metric.

- How to track progress percentage?
The calculation compares the budget (in time and value) to the actual results from the employees' activity reports. When the project management tool you use also allows you to re-estimate the costs of projects, the progress can then be measured against the last forecast, so it is more accurate.
Indicators related to team management
The utilization rate (or billable utilization rate)
- Purpose of the utilization rate
The activity rate, excluding holidays, ensures that the teams produce work that provides the expected profitability. When projects are invoiced to customers such as in service companies – such as consulting firms, IT Services or agencies, the turnover, depends directly on the Project invoicing.
The company's main resources, its employees, must spend their time on billable (revenue-generating) projects rather than internal projects. Internal projects can have a favorable impact on profitability (deployment of an ERP solution to generate productivity gains, simplification of processes, business activity), but they do not carry direct profitability.
It is not uncommon to set Objectives of utilization rate different according to the different populations of employees. For example, in a consulting firm, junior employees are often expected to have a utilization rate very high, often above 80%. On the other hand, managers spend more time developing the business and therefore have objectives of utilization rate lower.
Definition. The billable utilization rate (Activity Rate excluding leave) measures the share of billable time consumed out of the total available time, excluding leave. Formula: (billable hours / available hours excluding holidays) x 100.
Healthy target. In a consulting firm and in IT Services, the area allowed ranges from 70% to 85%. Below 70%, the margin deteriorates rapidly. Above 85%, the team is overloaded and the quality drops.
Difference with the occupancy rate. The occupancy rate includes productive non-billable days (pre-sales, internal training, time off). The billable utilization rate excludes them to measure gross business performance.
- Utilization rate: how to track it?
Employee activity tracking should cover all types of time consumed, not just loadable projects. He will also charge training, internal projects and work on commercial proposals to get new contracts. For managers, it includes HR work and time spent with candidates in job interviews.
The activity monitoring software (Activity Report) allocates time to all these categories and produces a consolidated report. Visibility covers utilization rate past and future (the latter depend on the resource planning), by employee, team, or population type. With this visibility, identifying the issues that are holding back profitability becomes simpler.
occupation rate
- occupation rate's goals
Unlike the utilization rate, the occupancy rate will make it possible to monitor the overall workload of employees, whether on projects sold to customers or on any other type of activity. Some employees, even if they have utilization rate weaker ones do not necessarily have less intense activity.
A finance manager, for example, will work more on internal projects than other employees, often with a heavy workload. They will then have a high occupation rate.
The occupation rate is calculated by the following formula: 
Detailed formula. Occupancy rate = (billable hours / total attendance hours) x 100, leave included in the denominator. Also called TACI (Activity Rate Including Leave).
Healthy target. In consulting firms, the area allowed ranges from 70% to 78%. The CIAT is mechanically lower than the billable utilization rate, since the days off increase the denominator.
When to use it instead of the billable utilization rate. The TACI is used for HR management and the calculation of the annual workload plan. The billable utilization rate Used for monthly sales management and cost price calculation.
- How to monitor this indicator?
It is particularly interesting to have a predictive view of this metric. Seeing the workload of employees in the coming periods, not only on projects but also possibly on other categories of activity, makes it possible to identify the problems of overcapacity or undercapacity that are materializing. It will thus be able to react and correct the course by hiring, for example, in the case of undercapacity. To optimize resource management, it is important to have project governance in place to stay aligned with business objectives.
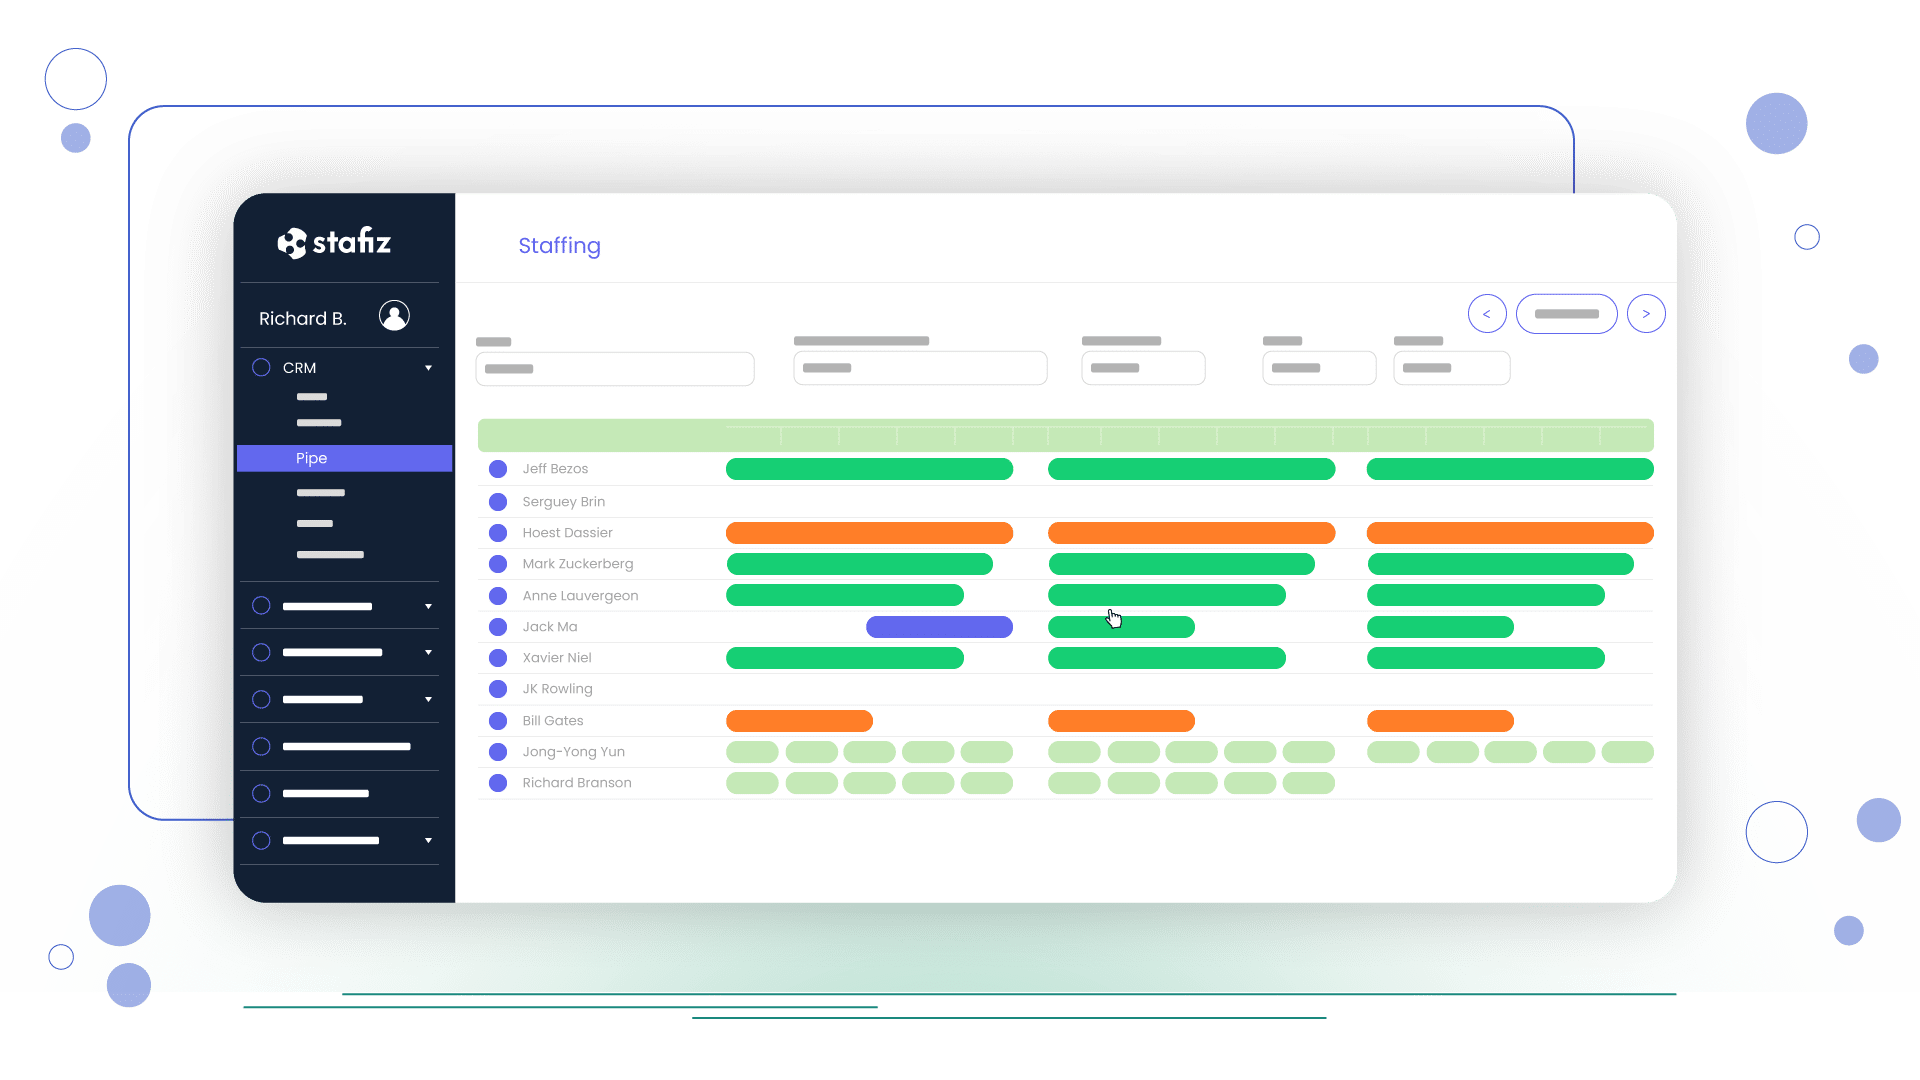
occupation rate tracking in Stafiz
Production
Production, when defined as part of a project, can be tracked in value or time (usually in days or hours).
When we look at the production carried out in days , for example, it is the total time spent on a project to date.
For the production achieved in value, it is the total number of days spent on the project multiplied by the value of one day (often referred to as the Average Daily Rate). Its formula is as follows: (Number of days spent on a project) * (Value of one day).
Perimeter. In a service company, production refers to the value of the work carried out over the period, whether it is already invoiced or not. Formula: Production = invoiced turnover + change in stored production (WIP).
Not to be confused with the production carried out without invoicing. The WIP (seen above) is a component of total output, not its equivalent. The WIP monitoring zooms in on the project cash flow. The overall production presented here is analysed at the practice or portfolio level, as an indicator of turnover in progress.
- Production monitoring purposes
It is often interesting to track production and production capabilities at the level of a team or company. Depending on the number of employees and their availability, it is possible to read the production capacities in days or value. A well-organized and optimized company will always seek to align its production capabilities with its revenue objectives and growth. Tracking this metric aligns business goals with available resources.
- Example
JAVA has 100 developer employees, including the ADR is set at €800 as standard, and 50 consulting employees who have a ADR of €750. On average, all employees work 217 days. The total production capacity is therefore :
[100 x 800 + 50 x 750] x 217 = €25,497,500.
Theoretically, with constant shifts, the pipe must cover a minimum contract amount of €25.5 million.
- How to monitor this indicator?
In an activity management solution, you often have the possibility to track the production carried out, but also sometimes the planned production. Together with the forecasts, the indicator reveals the remaining capacity over the next periods. He then quantifies the commercial effort to be made to cover at least the company's resources.
Indicators related to the overall project financial monitoring
If you're in charge of multiple projects or a manager, also track metrics that give a more holistic view of business performance. It is therefore interesting to follow these five indicators.
Commercial pipe

Commercial pipe tracking
pipe corresponds to opportunities identified but not yet won. Monitoring the pipe sales pipeline enables us to anticipate future sales linked to these opportunities.
- Pipe monitoring purposes
The follow-up of the pipe The commercial function determines the visibility of future turnover in any company, not just those that work in project mode and sell services. In addition to anticipating sales performance and being able to predict future turnover, this monitoring makes it possible to anticipate resource needs to respond correctly to future projects.
In this context, team leaders and managers derive real value from a clear visibility on the maturity of opportunities and the associated resource needs.
- How to track the commercial pipe?
A project management tool is essential to centralize all opportunities, and if possible segment them by maturity or chance of success.
Ideally, the stage of progress of the opportunity (prospecting, offer sent, negotiation in progress) is identified. A percentage of chances of success then weights the associated amount and gives a more realistic view of future turnover.
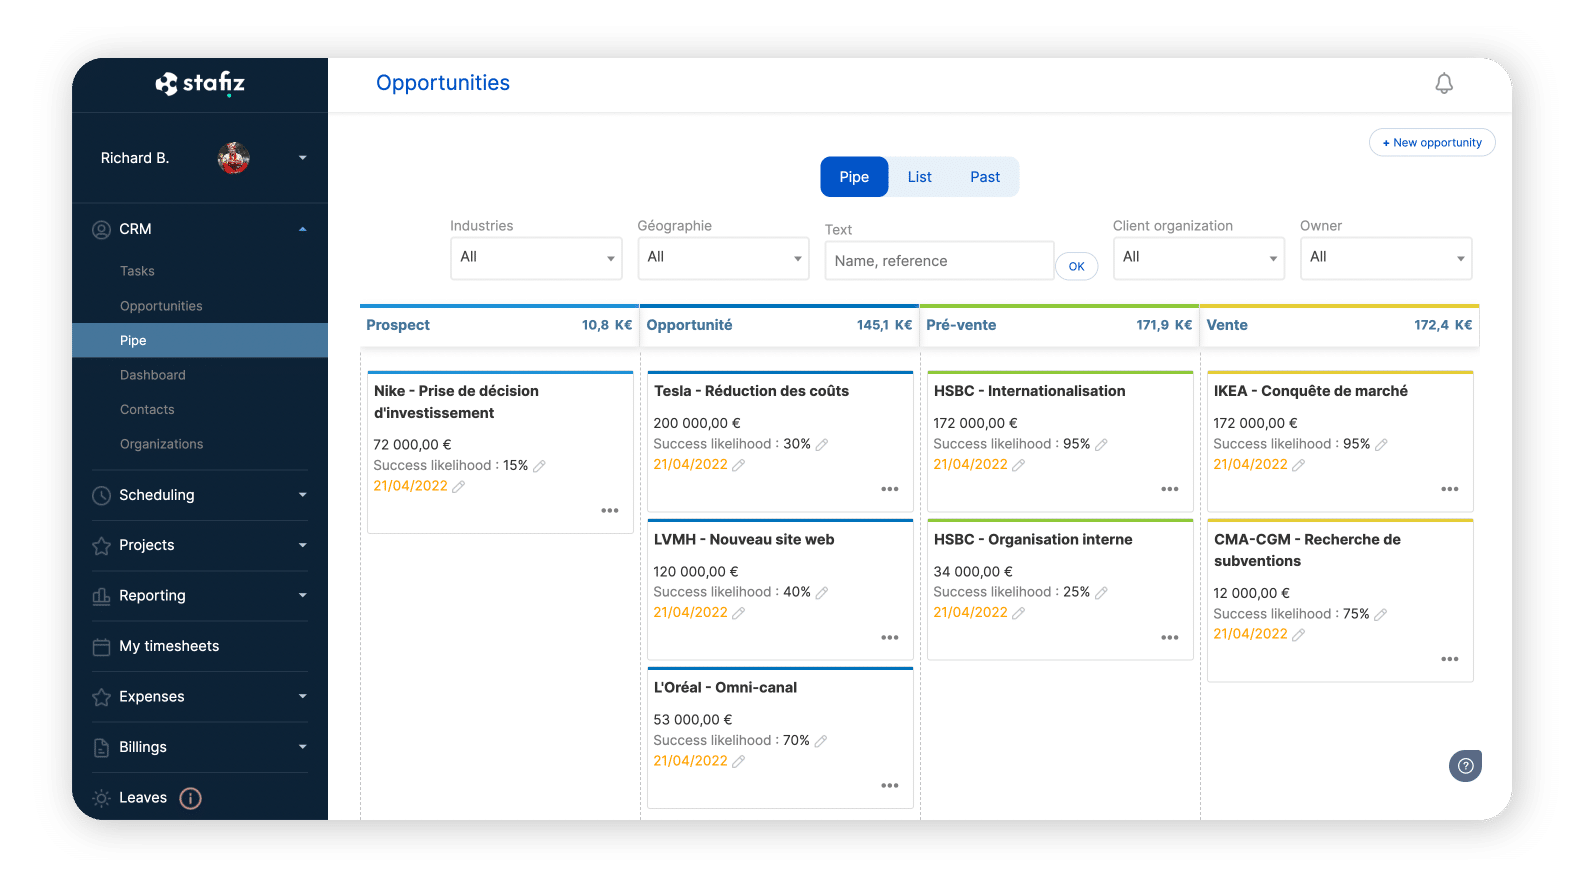
Business Opportunity Management
Pre-staff your teams and anticipate your resource needs as soon as the opportunity arises with Stafiz. Once the opportunity is won, the project creation is automatic, keeping the data from resource planning and budget information previously provided to save you time and better optimize the load.
When the CRM is adapted to resource management, it also publishes a workload plan associated with each opportunity. This plan details the roles that will work on the project, their duration of engagement, the applicable Average Daily Rates and the skills needed.
Depending on the maturity of the offer, the needs can be pushed to the planners or team managers. They then identify the employees who will meet the need. If the required skills are not available, they alert to launch the recruitment of external candidates or subcontractors.
Link the pipe to make sure that the right casting is done to meet the needs of the project.
The Cost of Customer Acquisition
It is the set of commercial costs that are necessary to sell the projects. This is the time spent by the teams writing proposals, the time spent on the sales activity or on the road to discuss with prospects. It is also travel expenses in the pre-sales phase or all other expenses incurred as part of a call for tenders, for example.
- Acquisition Cost Tracking purposes
Monitoring customer acquisition costs is another crucial indicator for ensuring the profitability of sales activity. In a way, it's the investment needed to land projects.
The value generated by the contracts associated with the activity must remain higher than this commercial investment. The ratio of 3 times the value to the acquisition cost often stands out as the minimum to be reached to maintain good profitability.
Well monitored, this indicator also makes it possible to compare the performance of salespeople with each other. This is an excellent indicator that goes beyond the amount of turnover earned by the salesperson.
- How to track the acquisition cost?
Tracking business activity and costs requires a solution that tracks time spent, fees, and expenses. The solution then assigns them to each opportunity, or to more general activities such as prospecting by email or attending a trade fair. Having knowledge of the cost of each salesperson, it is then possible to calculate the total sales cost spent on each opportunity and on other sales activities, per employee.
Depending on the project management tool you use, you then generate dedicated reports. They detail the acquisition costs overall, by team or by salesperson. They measure the profitability of this cost in relation to the amounts of turnover generated.
Actual and Projected Revenue
Calculating turnover for projects can be quite complex because several methods are used, such as the progress method or the completion method for example.
The progress method will make it possible to recognize the turnover in the income statement according to the percentage of completion. This percentage of completion is generally calculated as a percentage of the costs charged to the project compared to the total costs planned on the project. It is calculated as follows:

Via the completion method, the turnover is only recognised at the end of the project.
- Purpose of Revenue Monitoring
There is no doubt that tracking project revenue is a key KPI. Whether projects are billed internally or to clients, applying revenue gives value to the time resources spend on the project.
Even on internal projects that are not invoiced, the application of an Average Daily Rate to resources has an interest. It identifies the equivalent in revenue that could have been generated if the project had been sold.
- How to track turnover?
Tracking revenue can be quite complicated depending on the size and duration of the projects. Finance teams often use Excel templates. An ERP solution that automates and secures the calculation has two advantages: it frees up time for support teams and it makes the metric available in real time to finance teams, project managers and managers.
Profitability Monitoring
Monitoring the profitability of a project entity involves measuring the profitability of the different projects one by one. The analysis also covers the different types of costs: team costs, outsourcing costs, fees and other expenses.
- Profitability Monitoring Goals
This monitoring verifies that the activity generates profits at the expected level. Not all project activities are intended to generate profit. When this is the case, a global view of past and future profitability is required, systematically compared to the budget.

Monitoring the profitability of the activity in Stafiz
- How to monitor the activity's profitability?
A follow-up on an Excel template can be enough when there are not many projects. A dedicated solution brings several advantages: automation of monitoring, security of calculations, visual dashboards. They immediately identify the problems of budget overruns, their reasons, and the location of the discrepancies.
Project invoicing
The aim here is to monitor the progress and completeness of the invoicing in relation to what was envisaged. This monitoring must go as far as monitoring payments to have a good control of your cash flow.
- Purpose of billing tracking
The performance of the activity does not stop at the achievement. The amount sold must be collected, as quickly as possible, to maintain a healthy cash flow. The invoicing process must be organized.
Billing deadlines (the deliverables that trigger invoicing) are tracked up to date. Communication between project managers and billing teams remains fluid, so you can invoice as soon as the trigger drops.
- Billing deadlines are tracked up to date.
- All billable items have been invoiced and nothing is forgotten: in a project, not only are the deliverables billable, but it is also common to re-invoice fees for example. It is important to follow up on these elements, otherwise re-invoicing is forgotten and money is left on the table.
- The payment terms are respected by the customers.
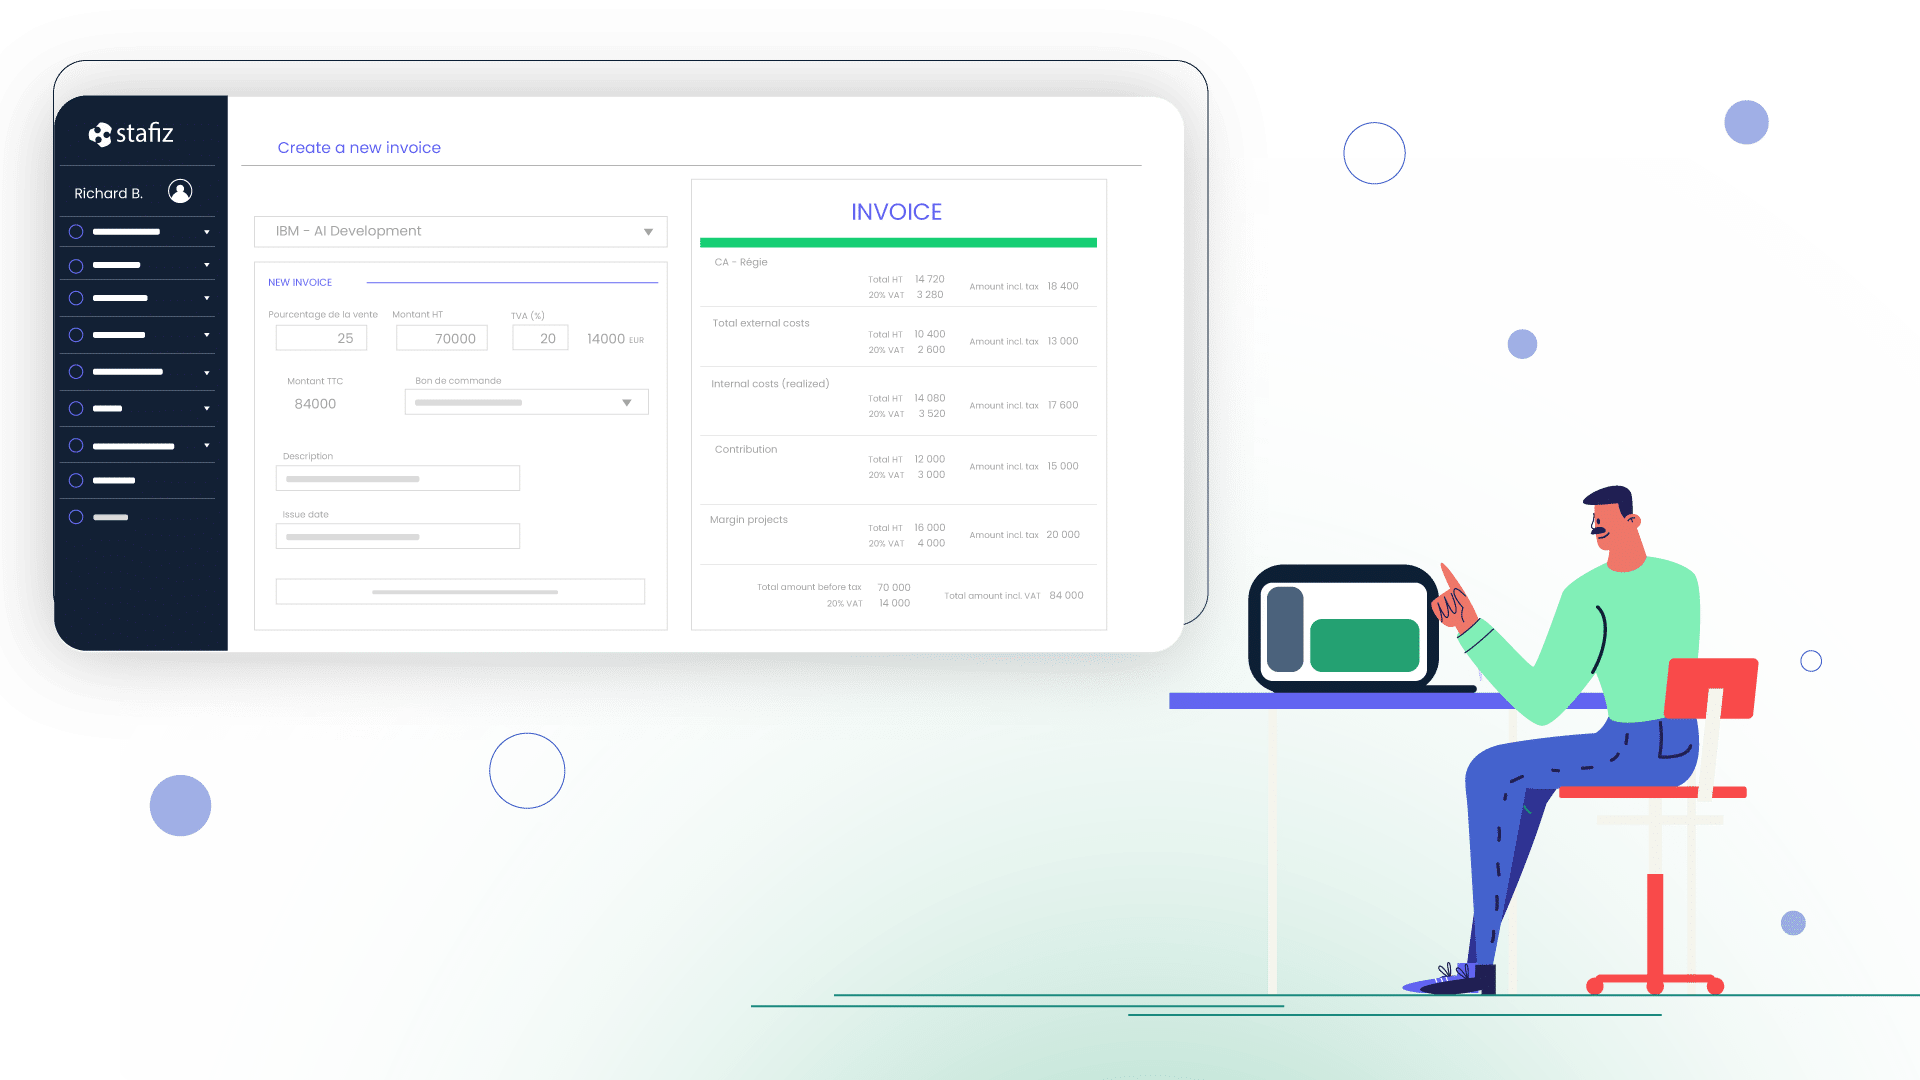
Project invoicing tracking with Stafiz
- How to monitor this indicator?
It is necessary to track project by project what has been invoiced, what remains to be invoiced, what has been paid. The identification of unpaid invoices must remain fast. It's always easier if the invoicing follow-up is linked to the project follow-up.
When the progress tracking and invoicing elements are linked, for example, it is possible to let the project manager confirm the production of a deliverable in order to trigger an invoice. The teams in charge of invoicing then see this deadline appear as an invoice to be issued, and can send it to the customer as quickly as possible. By accelerating the cash flow cycle, the entire cash flow of the business improves.
Real-time or monthly forecast margin: why the spread changes everything
The frequency of calculation of the forecast margin has a direct impact on the actual margin on landing. A monthly margin is calculated after closing the time and accounting arbitrations: the manager discovers the difference 4 to 6 weeks after it appears. A real-time forecast margin is recalculated for each time entry, each addition of expenses, each modification of the balance to be made.
Three effects result from this difference in frequency:
- Early detection. An hour consumed outside the budget is visible on D+1, not on D+30. Over a 4-month project, that's 90 days of arbitration gained.
- Cold refereeing. The project manager can reallocate a resource, negotiate an amendment, or adjust the scope before drift is consolidated.
- Advance provision. If the forecast margin turns negative, the loss at completion is provisioned as soon as the event is known, in accordance with IFRS 15, without waiting for the monthly close.
On a flat-rate project of 200 man-days at €1,100 sold, a drift of 10 man-days represents 5% of the total budget. Detected in the first week, it is compensated by adjusting resource planning. Detected at the end of the closing, it results in an endorsement that is difficult to negotiate or a deadweight loss.
The technical condition: a system that continuously reconciles time tracking, expense allocation and the remaining costing. Without this automatic reconciliation, real-time control remains theoretical.
This is precisely what Stafiz calculates as standard. The provisional margin is recalculated for each entry. Alerts are triggered on thresholds set by practice: margin below a floor, occupancy rate above a ceiling, drift consumed on budget greater than a number of points.
How to select your project KPIs: 4 criteria to avoid weak indicators
A weak KPI can be recognized by the fact that it does not trigger any decisions. It occupies a line in a dashboard, feeds a weekly update and does not act on anything. Four criteria filter the right KPIs for cosmetic indicators.
1. The KPI is linked to a numerical objective
An indicator without a goal is a metric. A KPI links the measure to a quantified and dated target. "Improving the utilization rate " is not a goal. "To reach 78% of utilization rate on the consulting portfolio in Q3 2026" is one of them.
2. The KPI has an explicit alert threshold
Without a threshold, the data floats. The threshold defines the neutral zone, the vigilance zone and the action zone. For the margin at project completion: neutral zone above 25%, vigilance between 15 and 25%, action below 15%. The thresholds are specific to each company and each type of project (fixed price vs. time management, long vs. short mission).
3. The KPI is attached to a person responsible for the action
If three people can act on a drift, no one acts. Each KPI must be associated with a single manager: project manager for the forecast margin, practice manager for the utilization rate, Sales Director for the pipe weighted.
4. The KPI is available at the frequency the decision is made
A monthly occupancy rate is useless for a project manager who is the resource planning every week. A KPI serves the decision-making rhythm of the person who acts, not the production rate of the accounting. The rule of thumb: the frequency of the KPI should be at least twice as fast as the frequency of the decision it feeds.
Validity test. For each indicator in your dashboard, ask four questions: what numerical objective is it attached to, what threshold triggers an action, who is acting, how often is it refreshed. Indicators that do not answer all four questions do not belong to the scoreboard.
From KPI to dashboard: how to equip real-time monitoring
Build the dashboard
A useful project dashboard fits on a screen and gives three pieces of information in less than 30 seconds: where the margin stands, where the resource planning, where is the billing status. Three families of indicators, ten maximum, organized by alert level (red, amber, green).
Recurring errors:
- Stacking indicators. A 25-line dashboard is not a management tool, it is a report. The project manager no longer consults him.
- Mix frequencies. Data updated daily rubs shoulders with monthly data: the eye no longer knows what to look at.
- Include non-threshold indicators. A single figure says nothing. A number compared to a target and a tolerance zone triggers a decision.
The tools that calculate these 12 indicators natively
Three families of tools produce the dashboard automatically, without redundant input:
- The service company business ERPs (Stafiz, Akuiteo, BoondManager+finance module, Furious): the 12 KPIs are available as standard, recalculated for each time entry. They are part of the resource planning, invoicing and cost accounting on the same repository.
- Pure PSA tools (Mavenlink/Kantata, Replicon, Certinia): they cover the project and the resource planning, but the integration with invoicing and accounting depends on the IS in place.
- Spreadsheet solutions (Excel, Google Sheets connected to extracts): viable for up to 20-30 projects in parallel. Beyond that, the maintenance of the formulas consumes more time than the management they produce.
The dominant criterion of choice in the firm and in the IT Services : the tool's ability to recalculate the forecast margin in real time from time entries, without manual monthly reconciliation.

Project analysis or portfolio analysis: what changes in management
Managing a project and managing a portfolio of projects are based on the same indicators, but the thresholds, frequencies and associated decisions change.
At the project level, the project manager monitors the margin at completion, the completion rate and the rest to be done. The frequency is weekly. The typical decision is tactical: reassign a resource, request an amendment, adjust a deliverable.
At the portfolio level, the practice director or the director of operations looks at the distribution of project margins, the weighted average occupancy rate, and the coverage of the projected turnover by the projects signed. The frequency is monthly. The typical decision is structural: stop or extend a type of mission, resize a team, adjust the price grid.
Three portfolio-specific indicators are added to the 12 project KPIs:
- The coverage rate of the projected turnover : share of the year's turnover already backed by signed projects. At 70% at the beginning of the year, the ride is comfortable. At 40%, commercial pressure becomes a priority over operations.
- Contribution margin per client : the consolidated gross margin of a client on all its projects. A client with a medium margin can hide a deadweight loss project compensated by another with an over-margin.
- The flat-rate/management mix : balance between fixed-price assignments (margin risk borne by the service provider) and time-based assignments (risk borne by the client). A mix that is too unbalanced towards the flat rate exposes you to a cascade of PATs in the event of a sector drift.
The consistency rule: portfolio KPIs must be calculated from the same definitions as project KPIs. Otherwise, the practice director and the project manager arbitrate on different figures and no longer understand each other.
Stafiz helps service companies gain visibility and better manage the progress of their projects with real-time data. Stafiz is a SaaS for managing the resource planning, project management and Business Intelligence. This way, budgets and margins are always respected and you make better decisions for your business.
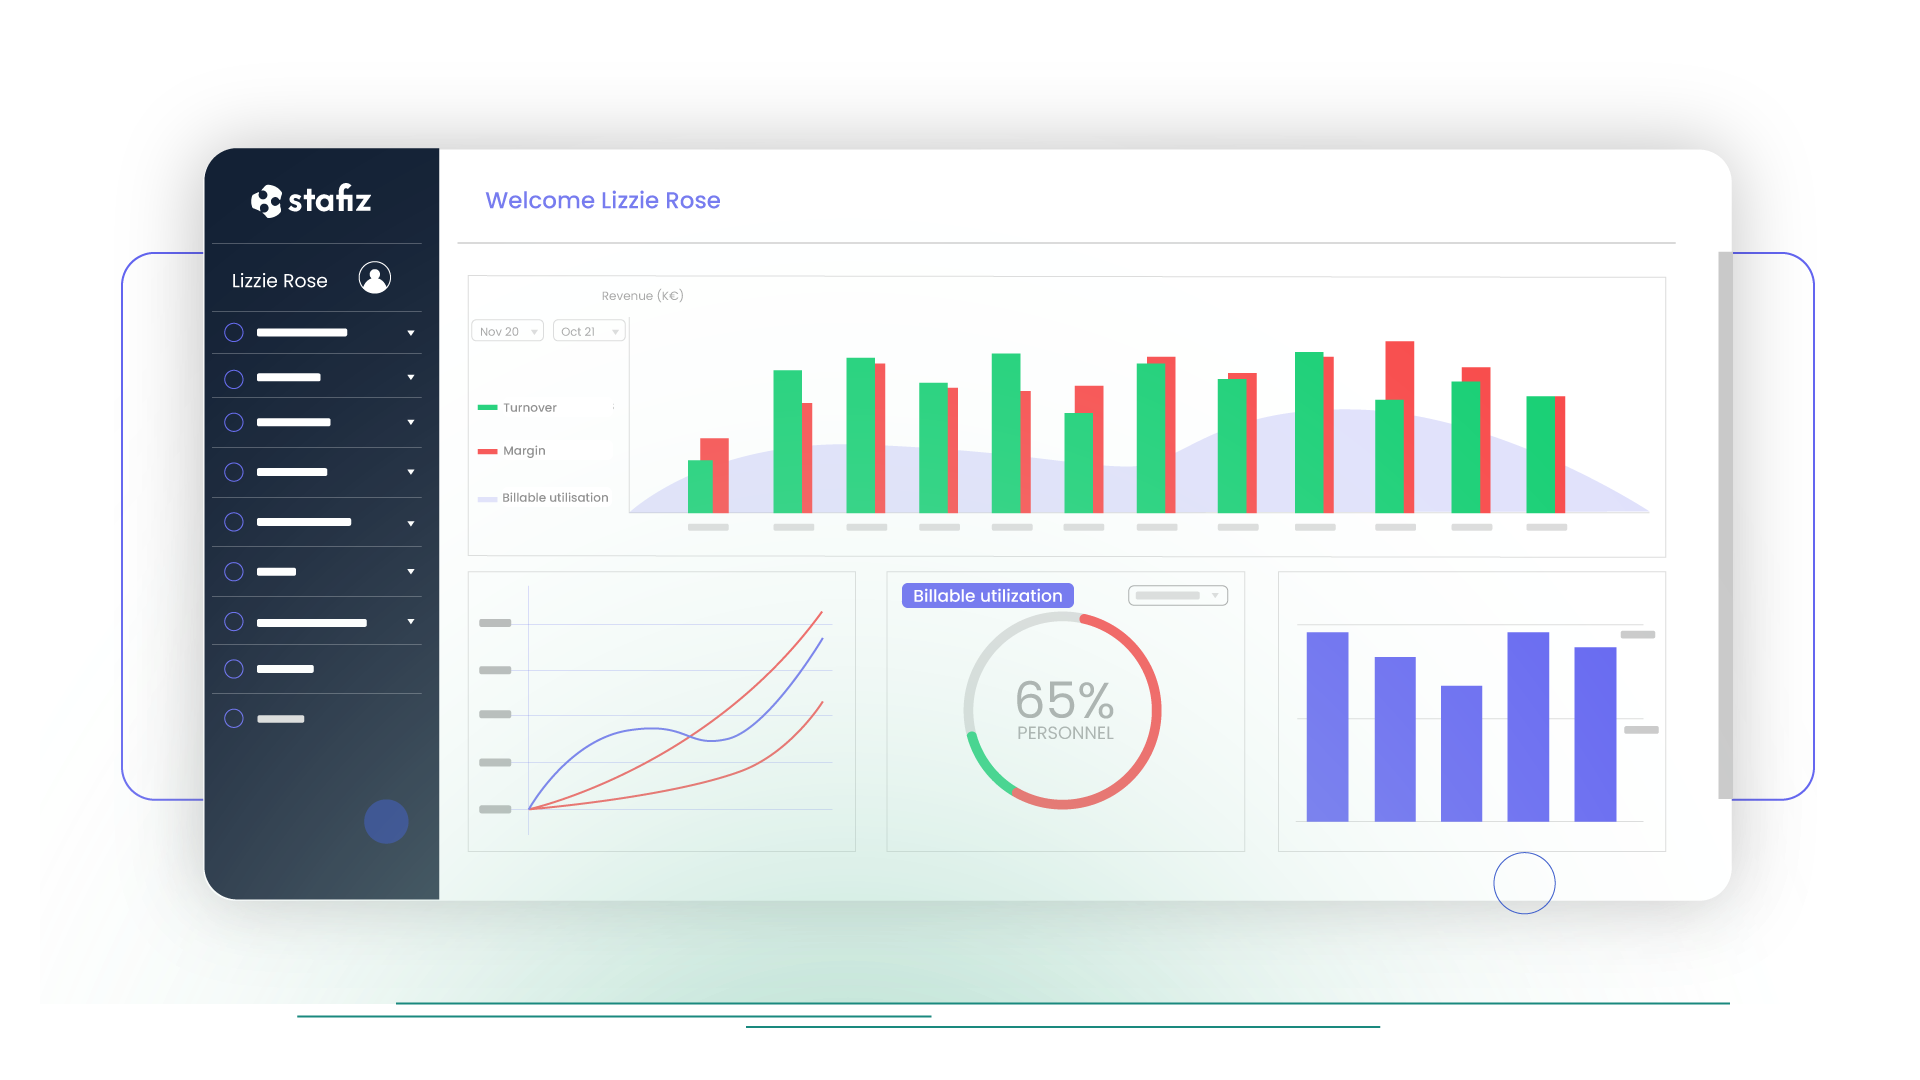
Project Portfolio Management in Stafiz
Frequently asked questions:
An indicator is a raw measure, for example the number of hours consumed on a project. A KPI (Key Performance Indicator) is an indicator linked to a numerical objective and an alert threshold. All KPIs are metrics, but not all metrics are KPIs.
Three KPIs are enough to detect 80% of project drifts: the margin at completion (estimated final margin), the completion rate (hours sold out of hours consumed) and the remaining cost (valued remaining expense). The other nine indicators refine the diagnosis, these three trigger the alert.
Margin at Completion = (Expected Revenue − Estimated Total Cost at Completion) / Projected Revenue. The estimated total cost is the sum of the costs incurred (time consumed, purchases, subcontracting) and the remainder to be done valued at the internal standard cost. The calculation is reliable if the remaining work is updated every week.
The cost to completion (CAT or EAC) is the estimate of the total cost of the project at completion. The margin at completion is the difference between the expected turnover and this total cost. The loss at completion (PAT) is the recognition of a negative margin at termination, which triggers the obligation to provision for the loss in accordance with IFRS 15.
A project tracking indicator is a quantitative measure that reports on the progress, budget consumption, or quality of a project. It becomes a KPI when it is attached to a numerical target and an alert threshold that triggers an action.
A good project KPI meets four criteria:
- it is linked to a quantified and dated objective;
- it has an explicit alert threshold;
- he has a single person responsible for the action;
- it is refreshed at a frequency higher than that of the decision it feeds.
The acronym SMART (Specific, Measurable, Achievable, Realistic, Time-bound) summarizes these criteria in the management control literature.
A monthly margin reveals drift 4 to 6 weeks after its appearance. A real-time margin reveals it during the day. Over a 4-month project, that's 90 days of arbitration gained. The monthly margin remains useful in consolidation for the finance department, but it does not drive the project.
Four indicators are sufficient: the cost incurred (sum of the hours consumed valued and the expenses charged), the remaining to be done quantified, the total estimated cost at completion (committed + remaining to be done), and the variance from the initial budget. Cost drift is the difference between the estimated total cost and the signed budget.
Three KPIs structure the operational management of service companies: the occupancy rate (or utilization rate) of consultants, the margin at the completion of projects and the pipe weighted commercial market. They answer three different questions: do I have the right volume of activity, will my current projects be profitable, do I have enough signatures to cover the coming months. The percentage of uninvoiced production and the completion rate come next, to refine the diagnosis at the project level.