According to a Wellington study on the state of project management in 2018, only 40% of projects are completed on time, leaving a large majority of assignments delivered late.
These results are not a coincidence. It is very difficult to manage a project successfully because there are many pitfalls that make it difficult to manage throughout the project.
The causes of project failures can be caused by many factors: costs are higher than budget, communication problems set in, lack of visibility on the load lengthens deadlines. Sometimes, the objectives are even unclear on the part of the management.
The most effective way to avoid project failure is to monitor it effectively, from start-up through to completion. To meet this need, the project dashboard is an excellent tool.
What is a project dashboard?
A project management dashboard, also known as a dashboard, is a visual representation. It allows you to locate the state of health and progress of a project in an accessible way.
Several windows or modules are placed next to each other in a logical order to indicate whether the project objectives are being achieved, and whether there are critical signs that require special vigilance.
Project monitoring table: when should it be implemented?
The project dashboard should be shared as soon as the project is launched.
During the kick-off meeting, it's important to share this project tracking board and explain how it works to all participants so that everyone is aligned on the way forward.
The project manager should check that all important indicators are included, and ensure that sponsors confirm that they adhere to them. The wider and stronger the support at the start of the project, the more stakeholders will be invested in achieving the objectives set.
This step of sharing the project monitoring table is therefore crucial for the success of the project.
How is a project dashboard composed?
The project monitoring table and its components may vary from one mission to another.
However, as a general rule, certain information must always be included.
The people in charge
For a project to succeed, responsibility must be shared. Responsibility for tasks should be shared among the various project stakeholders.
Distributing responsibility involves appointing a person responsible for each of the tasks and clarifying the objectives: completion, quality and deadline. The project manager then becomes the conductor who helps the whole team to move forward, and who fluidifies the exchanges so that everything takes shape.
If stakeholders are not held accountable, the burden will be too heavy for a single project manager, and the chances of failure will be greater. Each manager must be aware of the tasks for which he or she is responsible in order to be able, in return, to indicate how they are progressing.
Each manager must be able to indicate what remains to be done so that the associated load is updated on the graphs or any other visual support on the dashboard. Some tools allow you to indicate a percentage of completion, such as Stafiz, for example.
Deadlines
To ensure that the project is completed on time, deadlines should be set for each phase and task of the project.
This is a commitment that must also be confirmed at the beginning of the project. The manager should confirm the feasibility of the task within the time goals.
Performance indicators
A dashboard often involves tracking multiple metrics at once.
KPIs must adapt according to the task. The objective can be a number of hours or days not to be exceeded (when you want to control profitability), a number of deliverables to be produced or a quality rating reported by the customer.
As mentioned above, the choice of KPIs to track must be perfectly aligned with the sponsors' objectives.
Who is responsible for updating the project tracking board?
It is the project manager who is responsible for updating the project monitoring table. But in order to be able to consolidate the information, each task manager must be up to date in his or her follow-up.
Ideally, the information is updated in the same file and consolidates automatically. The project manager checks that the data is consistent and queries the various task managers if necessary to ensure overall visibility.
It is also at the time of this feedback that the remaining information must be calculated.
When tasks are not completed, indicate the time needed to complete the task. This allows the project manager to update the overall project schedule and recalculate the project's projected margins.
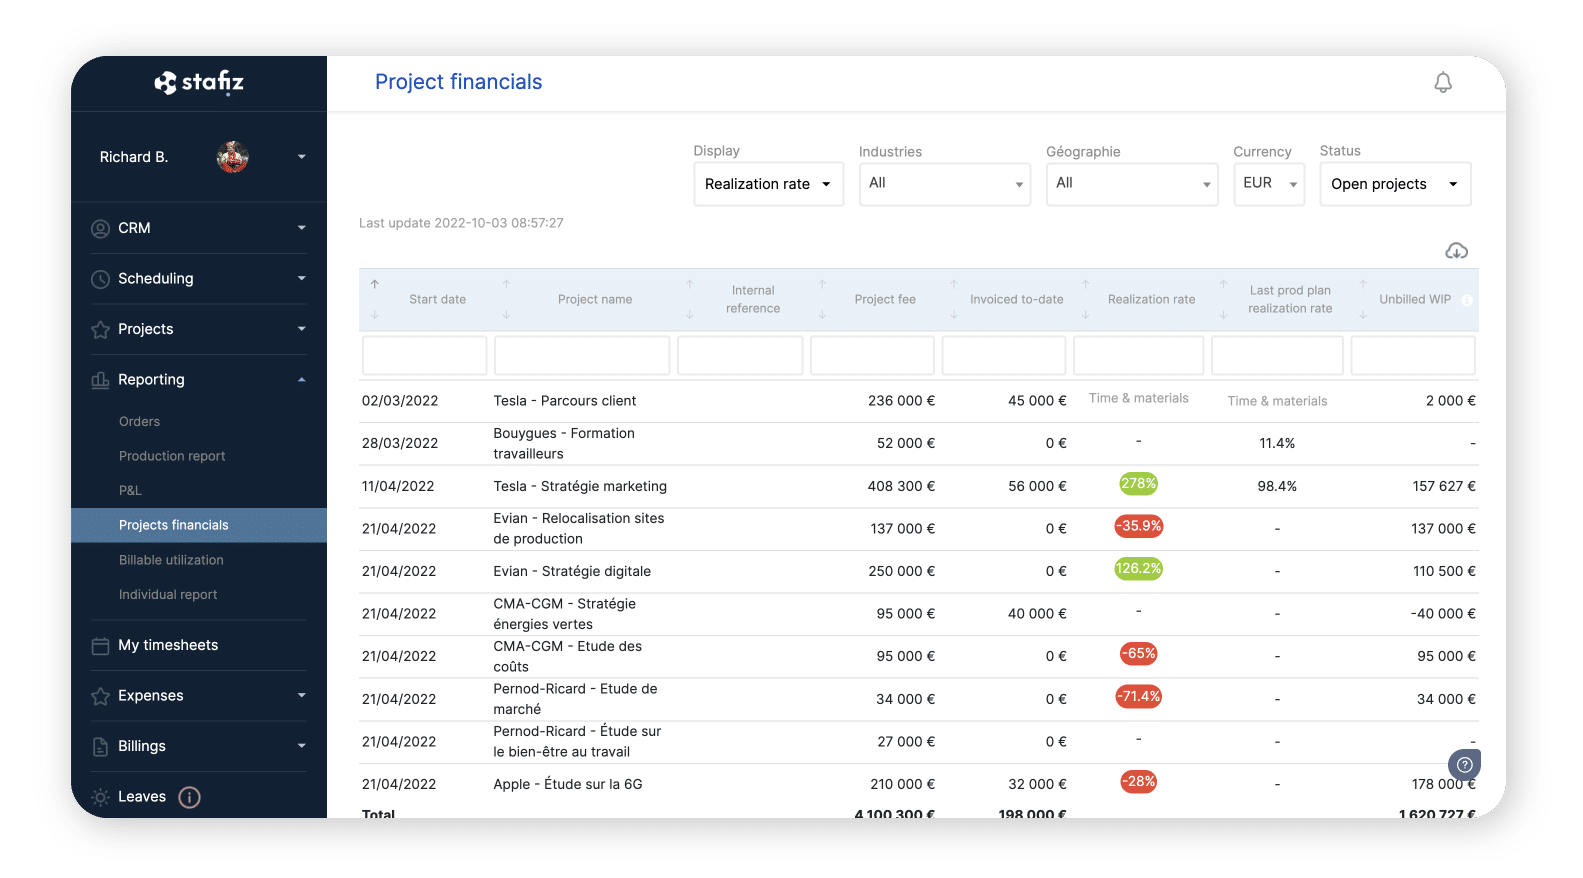
What does a project monitoring table look like?
The project dashboard is most often presented in an interactive interface through a project management and management software.
It is also possible to use dedicated tools such as Excel or Looker Studio which, once connected to your database, will be able to graphically represent your KPIs.
Although these solutions are popular for starting a business, setting them up can be long and tedious, especially when it is necessary to connect your data collection tool.
That's why a tool like Stafiz, which directly integrates all project monitoring data into an optimal dashboard, is ideal for offering you weak data without mobilizing effort!
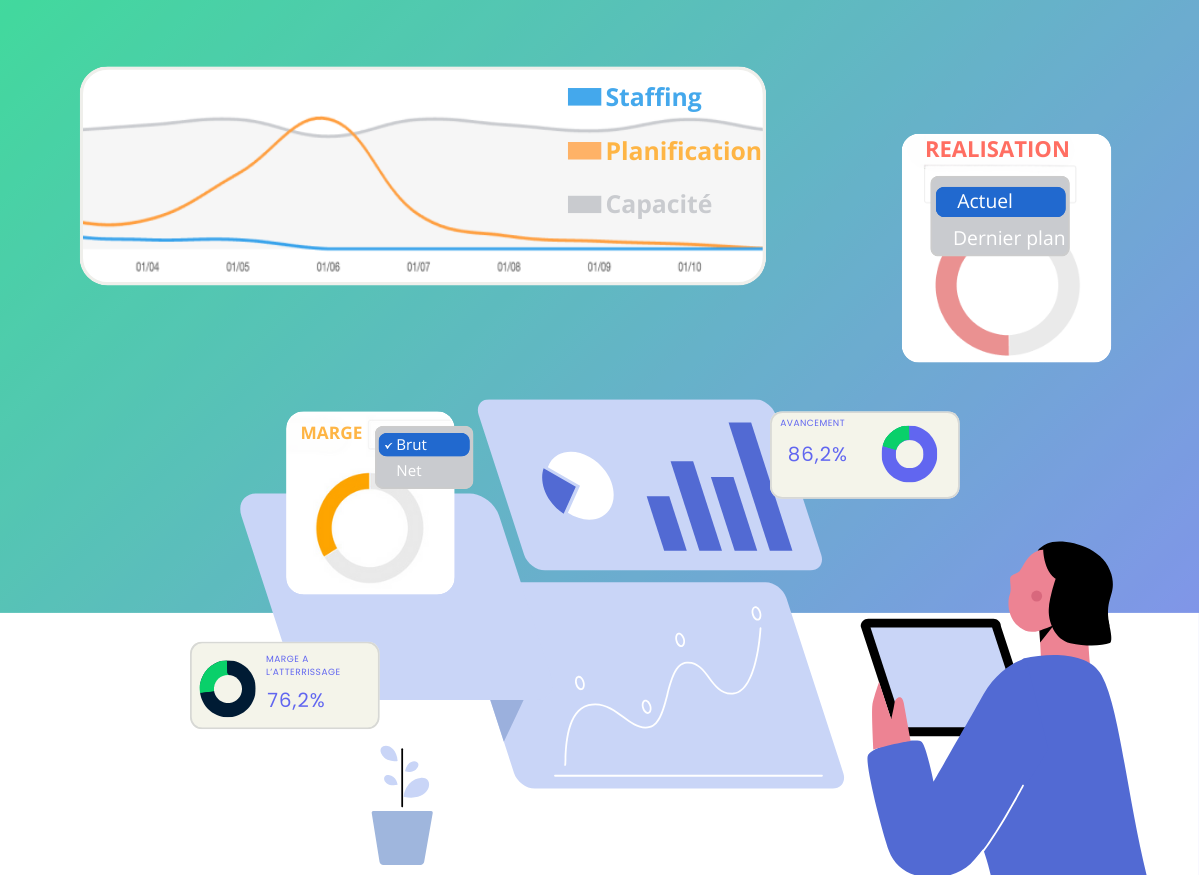
In order to facilitate the reading of the project follow-up, the monitoring table is laid out with graphs and other easily readable presentations.
It is important to make the right choice of schema to represent a piece of data, so that its interpretation avoids confusion and consequently, uninformed decision-making.
- Curves: they are ideal for monitoring numerical developments such as productivity, expenditure tracking, budget consumption or even a chronology.
- Pie charts: These circles are effective for representing percentages, such as task completion rates or overall project progress.
- Text: these areas are useful both for structuring your dashboard by giving titles or indicative captions, but also for laying out the data of figures for example.
- Tables: some data can be followed closely, or simply abound. A graphic representation is likely to mislead readers, so it is sometimes better to opt for simple tables whose effectiveness is no longer to be demonstrated.
What are the goals of a project dashboard?
Facilitate project monitoring
This monitoring must make it possible to identify any risks of failure throughout the project in order to carry out corrective actions as soon as possible. Project monitoring through a dashboard allows you to be alerted when a risk materializes and to understand where it comes from.
The project dashboard is also a communication tool. It allows all project stakeholders to be informed sufficiently in advance to make decisions more fluid and avoid unpleasant surprises. The earlier a problem is communicated, the higher the chances of finding a solution. No one wants to have unpleasant surprises at the end of a project, and this is how a well-done project follow-up allows you to fulfill this role of communication tool.
The project monitoring table must make it possible to share the status of the project on a given date, with clear information that is understood by all.
In the blink of an eye, everyone must be able to understand how the project is doing. That the subjects that are progressing well can be celebrated, and that those that need to be corrected can be identified and prioritized.
Following a project in a table format allows everyone to recognize an identical format from one period to another. It brings efficiency to the exchanges between the various stakeholders of the project and makes it possible to historize a situation in a clear way.
Improve performance: respect for deadlines, quality, profitability
The project dashboard is also intended to keep the project aligned with the objectives.
Depending on the priorities, different objectives are set:
- the respect of the deadlines of the different phases of the project;
- the expected level of quality leading to the potential validation of the customer;
- the level of project costs that must remain aligned with the project budget.
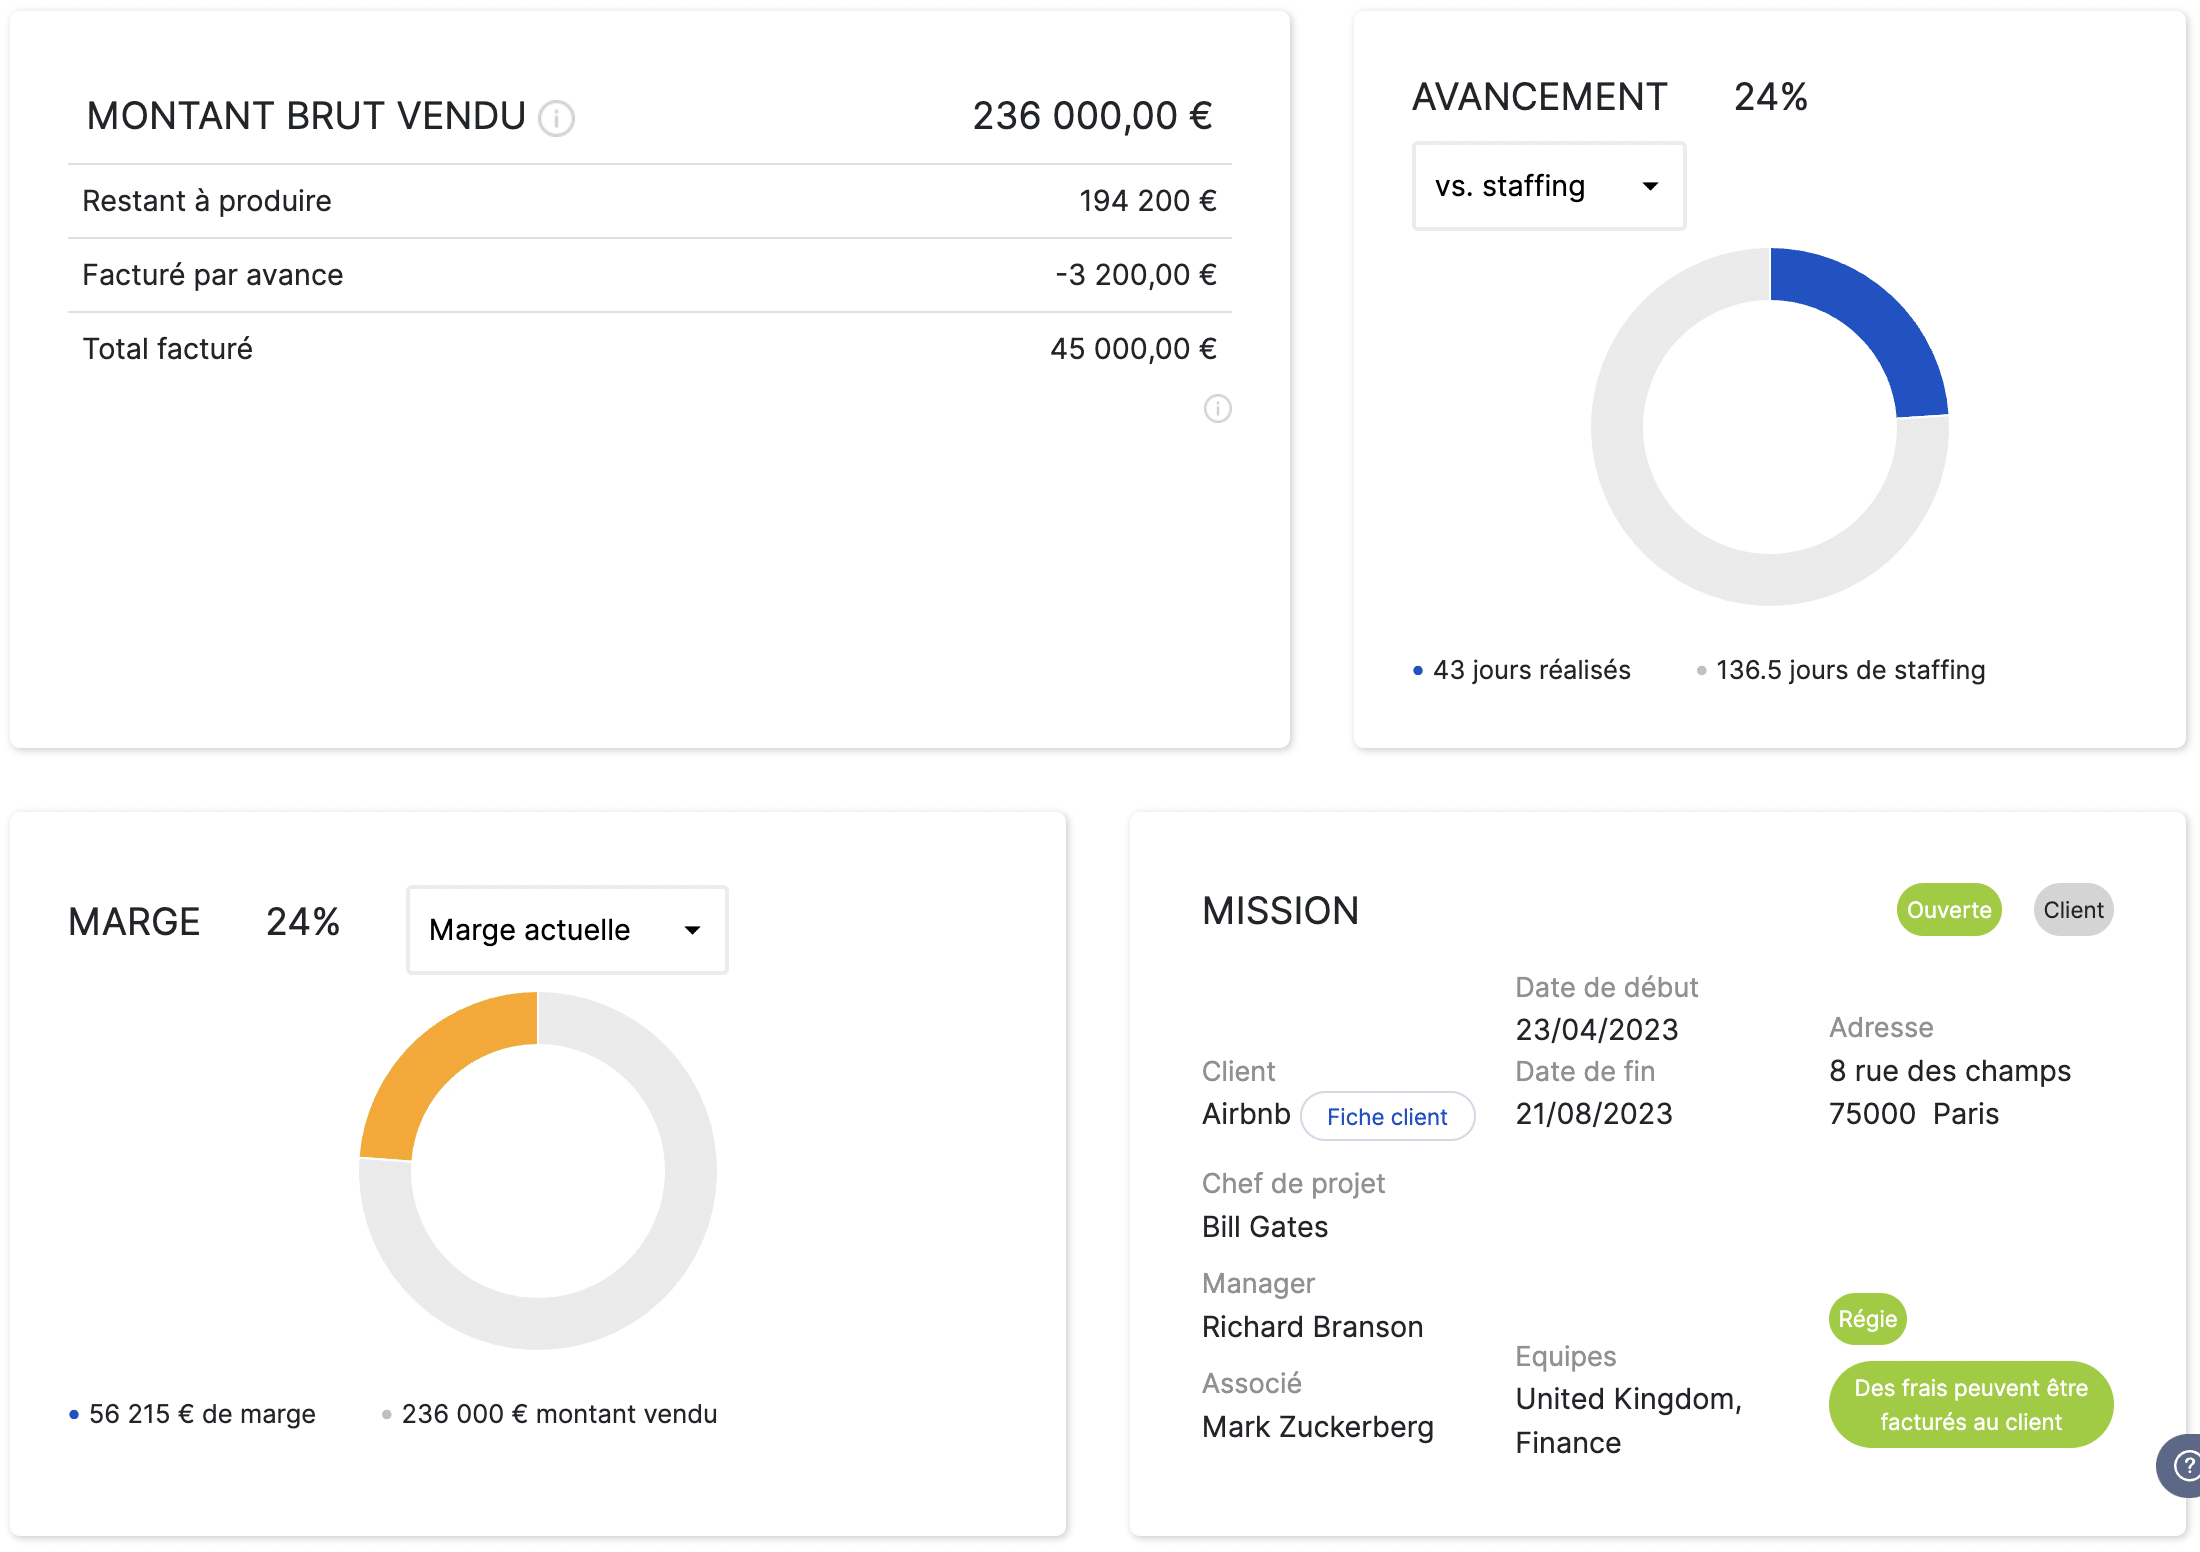
The dashboard compares the situation to date, the projected situation at the end of the project, and the budget for these different objectives.
Noting the possible risks of deviating from the objectives, the project managers carry out the necessary corrective actions: restructuring the project tasks to shorten it, renegotiating with the client, reallocating tasks to improve efficiency, etc.
What are the KPIs to track in a project dashboard?
To define the KPIs to be integrated into the project dashboard, it is necessary to first determine the priorities with the project sponsors.
Although it is possible to track many KPIs, it is important to avoid systematically tracking all the indicators. It is necessary to focus on KPIs that align with the priorities determined with the project sponsors, and therefore to determine where the priority lies.
Meeting deadlines
Tasks and subtasks must meet specified deadlines, and any overruns pose a risk to the project.
🔎 KPIs for monitoring deadlines: rate of progress, remaining to be produced, time gaps, rate of tasks completed on time.
The quality of the work
The various tasks must be controlled and scored according to the expectations in terms of quality. The project dashboard should show a comparison of the current quality of production to the expected requirements.
🔎 Quality KPIs: quality score, tasks to be reworked, customer satisfaction.
The profitability of the project
The project costs must fit within a certain envelope set through a project budget. Every budget overrun puts profit at risk, which is why it's important to track KPIs related to the project's financial health.
🔎 Profitability KPIs: costs and expenses, non-billable expenses, financial variances, budget consumption, current margin, projected margin.
Proactive project monitoring in Stafiz
Stafiz allows real-time, predictive monitoring of all your resources and their associated costs: resource planning, subcontracting, purchasing, revenue... You are alerted in the event of a future deviation.
How do I create a project dashboard?
There are many ways to create a project dashboard, and you're probably unsure about how to do it.
When creating the dashboard, keep in mind that the objective is to take the temperature of the project at all times. He must therefore provide all the information at a glance to know the health of the project on operational, analytical and strategic subjects.
Check out the steps below to create a dashboard based on your needs.
The operational project dashboard
The project tracking table should provide operational information first. That is, it should indicate the time left to complete the various tasks in the project and the associated burden on the people working to complete those tasks.
This remaining work should make it possible to adjust the capacity of the employees working on the project. For example, by indicating that they have eight hours left to spend on a task for next Monday, the equivalent capacity to work on other tasks must be adjusted so that it is zero.
At the same time, the tracker must display the progress of the project and its tasks. There are several possibilities for displaying progress: a percentage, a more visual progress bar... Whatever solution you choose, it should make it easy to see whether or not you're close to completing the task.
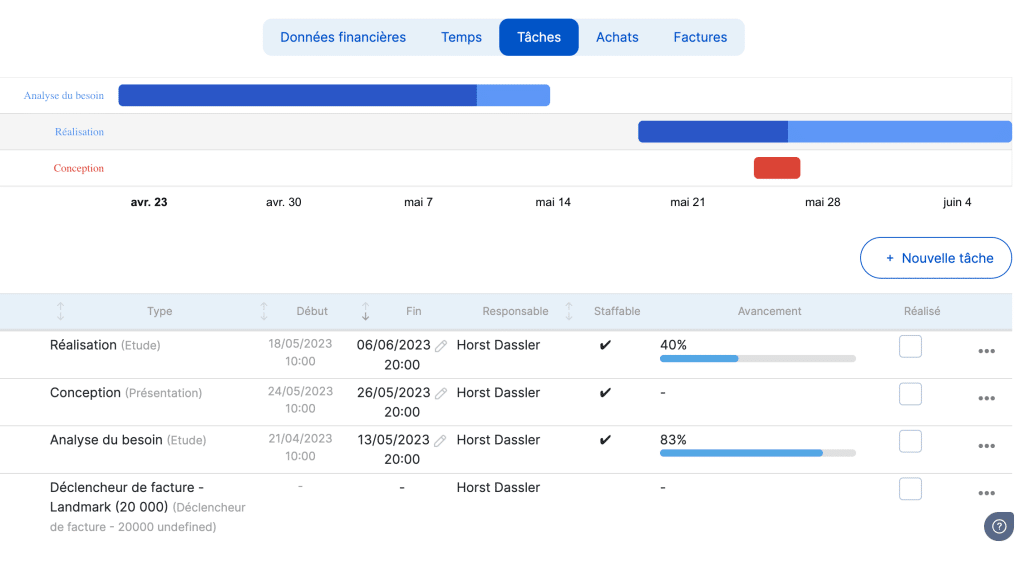
Beyond the progress of a task, if the planning approach makes sense, it is interesting to indicate when the task will be completed. Either by indicating an expected end date in the project tracking table, or by displaying it in a Gantt formatted schedule.
The analytics project dashboard
The project monitoring table must then provide an analysis of performance.
Displaying key performance indicators allows you to take the temperature of the project, but you need to go further to understand the reasons for over- or under-performance in order to better prepare your future projects.
For example, you should display the discrepancies between the overall objective and the last estimate and give the same information with the detail task by task or manager by manager. This allows you to understand where the gaps within the project come from and what the causes may be.
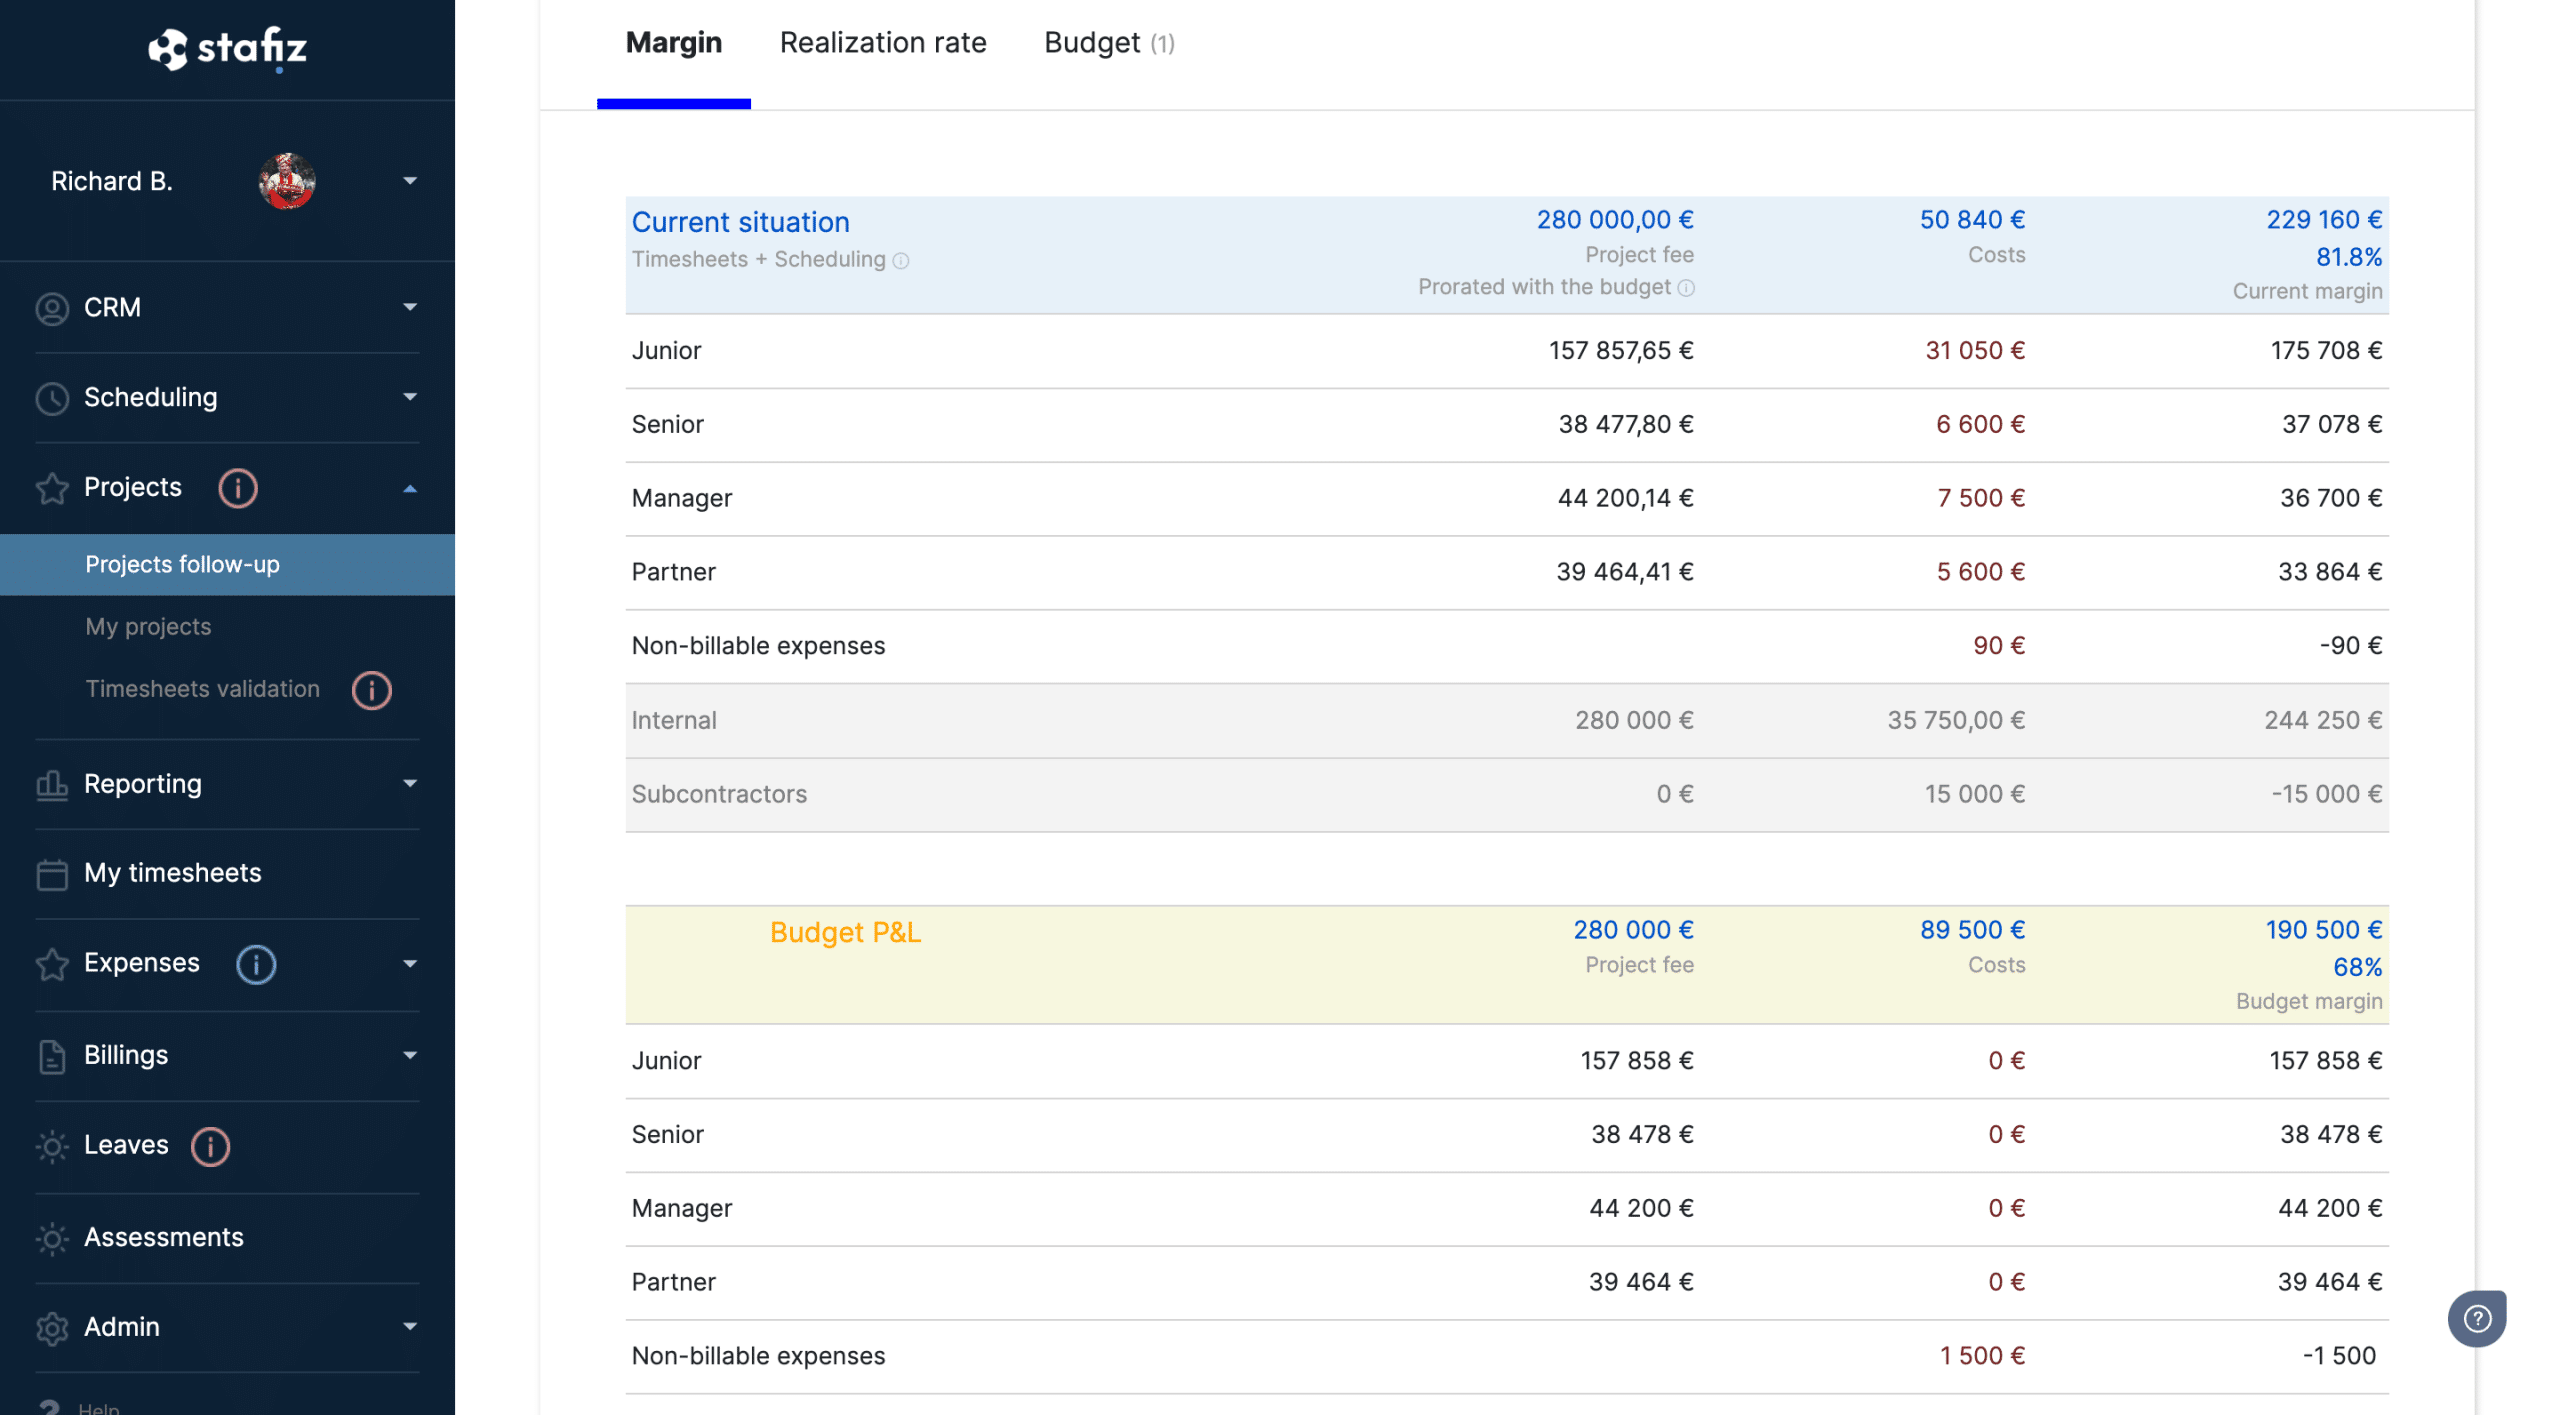
Analysis of the gaps between the initial plan and reality – Analysis by type profiles
A comparison of the project's performance compared to other similar projects also provides an interesting analysis.
Next to the project metrics, display an average metric for similar projects to compare their performance.
The strategic project dashboard
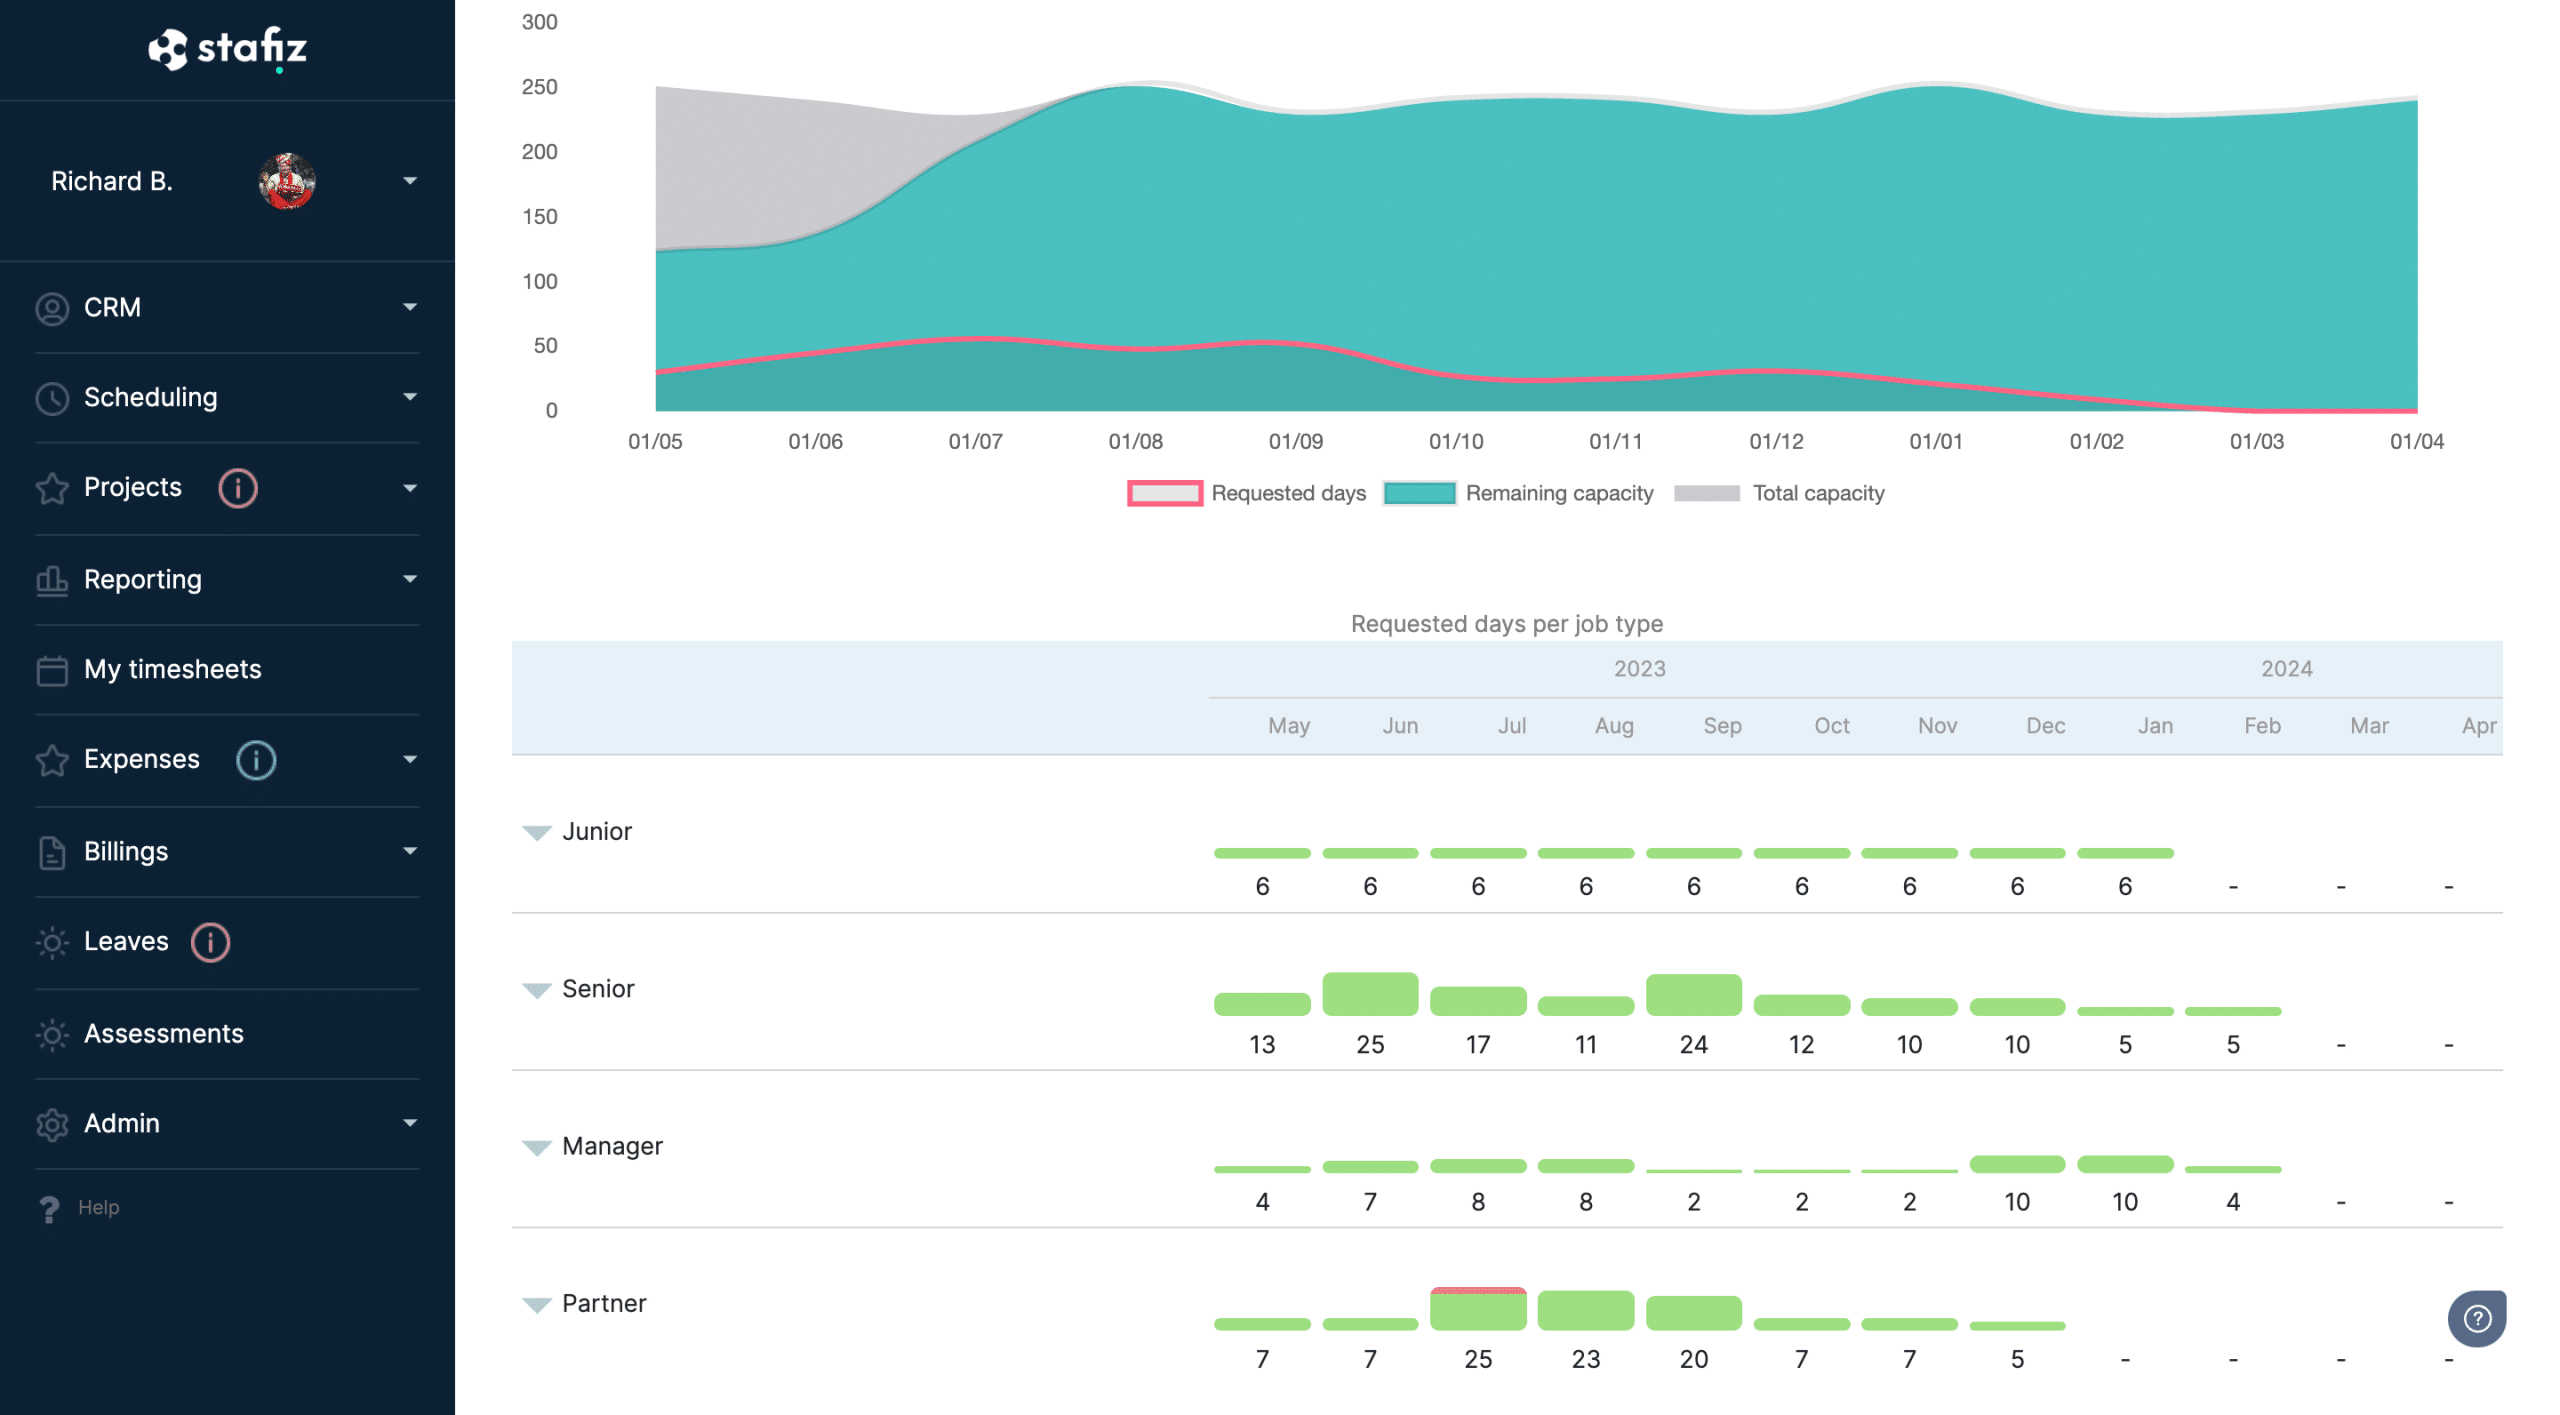
By consolidating the various project tracking boards, it is possible to provide strategic information that helps to make better decisions at the company level.
By consolidating the planned workload on the different projects, it is possible to have a complete view of the team's workload, and to know who is overstaffed or understaffed.
This information enables us to optimize the overall workload, and to know whether we need to recruit certain profiles that may be under-capacity in the future.
The financial data for the project and its progress enable us to calculate the sales and margins that will be generated in the coming months. Consolidation provides an income statement for the entire business.
By comparing the different project follow-ups, it is possible to identify interesting trends: which tasks most often lead to underperformance? What is the rate of deviation from the average budget? Statistics make it possible to better prepare and cost projects in the future and to improve margins.
To learn more about project tracking, check out our guide.
Project dashboard in Excel: the limits
The most frequent limitations to the use of excel to create project monitoring tables are numerous.
Investing in a dedicated tool is a first step towards growing your business.
| Excel | Dedicated tool | |
|---|---|---|
| Collaborative work | Difficulty working with several people at the same time on the file | Simultaneous connections and actions. Workflow sends and notifications. |
| Maintenance | Problem of managing a complex file. Creator maintenance | Maintenance supported by the publisher. Ensure licenses offer scalable maintenance |
| Agile views | Great. Excel still provides a lot of flexibility, but it's the last backup that determines the view | Views and angles of analysis can be saved so that each user can find their preferences |
| Time saving | Excel doesn't always allow you to automate actions. It is therefore not uncommon for its use to lead to double seizure | Dedicated tools allow processes to be connected to each other via API, for example. This avoids double entries |