
Updated June 1, 2026
Project cost management is an essential process in consulting and IT Services, covering four phases (framing, estimating, controlling, capitalising) to secure the margin of the mission in the face of the risks of overruns and to feed the costing of future projects.
Deadline, quality delivered, budget: a consulting orIT Services is measured on these three axes. The budget comes last in the daily management of a mission, and it ends up contaminating the other two. A mission completed on time but with a negative margin consumes more than it brings in. A mission delivered at the price of one resource planning overheating disrupts subsequent projects.
In a consulting firm and in IT Services, the margin of an assignment is due to a single difference: the difference between the man-days sold to the customer and the man-days consumed internally. This gap takes three forms depending on the mode of sale, but the financial mechanism remains the same: man-days are paid at the WJC (average daily cost) with no equivalent revenue on the other side, and the gross margin erodes proportionally.
Cost management is spread over four phases of a mission: project scoping, budget estimation, project management and closing. Each phase corrects a specific risk and feeds the next. Well conducted, they secure the planned margin of the current mission and feed the costing of the next project with real data.
🔎 Key elements to remember
- Definition and challenges: the set of actions that follow the budget of an end-to-end mission to protect the expected margin of risks related to the resource planning, over-limits and under-invoicing.
- Objectives: to anticipate the risks of overruns, to improve financial visibility for decision-making, to maximize the profitability of the mission and to facilitate the costing of future projects.
- Limitations of generic tools: Excel and generalist ERPs (SAP, Oracle) are not enough, due to the lack of real-time monitoring, automatic calculation of the margin on landing and native management of the resource planning multi-project.
- Consequences of poor management: actual margin lower than the expected margin, cash flow tensions due to non-invoices, under-calibrated pricing of future assignments and drifts discovered too late to be corrected.
- The four steps: framing (scope, costs, tool), estimating (provisional budget and buffer margin), controlling (time and performance gaps) and closing/capitalizing (financial balance sheet and ratios to refine future pricing ).
What is cost management?
Definition
Implementing effective management is essential because it allows you to establish the budget to be respected for the success of the project. Cost management must be planned from the start of the project, and monitored at each stage of its development.
Issues
Cost management requires understanding the environment in which the project operates. Indeed, this will make it possible to establish a realistic budget. In addition, it involves careful monitoring to ensure that the project is moving in the defined direction.
In terms of cost management, three mechanisms must be monitored as a priority to ensure that the budget committed does not exceed the margin:
- The resource planning : a resource planning deployed that differs from the one quantified in the estimate will affect the margin generated by the mission;
- the scope of the project : any deliverable produced outside the scope sold without an amendment or re-invoicing amounts to offering man-days to the customer free of charge;
- Invoicing : when an expense incurred for the client is not re-invoiced within the contractual deadlines, it risks being absorbed by the mission margin.
These three mechanisms share one thing in common: identified during the mission and anticipated by effective project cost management, they also open up corrective levers (replanning the resource planning, sign an amendment, restart invoicing). Detected at the close, they only give a deviation to be observed.
Why set up cost management on a project?
Controlled cost management makes it possible to:
- anticipate the risks of budget overruns;
- Fuel decision-making with clear visibility into project financials
- maximize the profitability of the project (resource planning, resources used, customer negotiation);
- to facilitate the planning of future missions in a similar context.
Why a spreadsheet or a generalist ERP is not enough for project cost management
Each of these solutions works on the first few missions, but reaches its limits when the number of projects active in parallel increases.
The Excel spreadsheet
Excel remains the most common solution for portfolios with fewer than twenty employees. Its flexibility allows you to model any margin or FAE calculation, as long as you have a contributor dedicated to updating the files.
Three limits appear beyond a certain threshold of active projects. Manual entries are a source of errors (wrong pasting, broken formula, obsolete version that circulates by email). Portfolio consolidation requires several hours of weekly reprocessing. The FAE does not recalculate itself with each time entry, so the landing margin is read a few days late, sometimes more.
Generalist ERP (SAP, NetSuite, Oracle)
Generalist ERPs are designed for industry or distribution, where management is done at the product, stock and production line level. The "business" link that structures a consulting or integration mission rarely exists natively.
The gap is mainly seen in three key functions.
- The resource planning is minimalist : generalist ERPs do not manage multi-project planning by profile and skills;
- time tracking is insufficient : CRAs and validation workflows are not at the heart of these softwares;
- the margin at landing per project (or any other business analytical axis such as a BU or a customer) is difficult to calculate and is often not part of a standard ERP. A software overlay can be added, but it makes the installation cumbersome and expensive to configure.
Accounting software alone (Sage, Cegid)
Sage and Cegid cover general accounting and payroll. Forward-looking management by mission is not within their functional scope.
On these tools, the finance department sees the costs incurred after the accounting close, so with a minimum of one month delay. The margin on landing can be calculated manually, mission by mission, or it happens outright.
What it really costs to manage poor project costs
Not managing your project costs, or managing them poorly, affects the profitability of the current and subsequent missions of the consulting firm. Here are 4 consequences that may indicate that the project costs of the current mission have been insufficiently managed.
Your actual margin is less than the expected margin. At the end of the accounts, the difference between the margin announced in the estimate and the margin actually realized is suddenly revealed. Without intermediate control, this gap is lodged without prior warning to the sponsor or the CFO. The result is in, and no one has seen the drift set in.
Cash flow is tight at the portfolio level and your working capital (WCR) is depleted. Man-days produced but not invoiced (production not invoiced, rebillable expenses pending, amendments not signed) are all costs borne by the consulting firm before the next collection deadline. On a portfolio of several concurrent assignments, these discrepancies add up and strain the cash flow without any visible cause in the accounts.
Your pricing may be under-calibrated for future assignments, impacting your future revenues. Without a reliable history of the margins achieved by type of mission, the following quote is based on the intuition of the head of mission. It incorporates a wider buffer margin to cover the unknown, making the price less competitive against the competition. Lost business on price accumulates without any identifiable cause other than the market.
You discover the drift when it is too late to turn the project around. The project manager, the production department and the finance department discover drift at different times, because they only notice it when they read their reference KPIs: delivery delays, resource planning unsuitable, increase in the intercontract, discrepancy between the actual margin and the expected margin. This discrepancy between readings often implies that the arbitration decision (taken by the COPIL) comes several weeks after the actual drift.
While the warning signs accumulate (sometimes silently), the time to act is decreasing and the corrective levers are disappearing one by one.
4 Steps to Effective Project Cost Management
Step 1: Frame cost management
Cost management depends entirely on the scope of the mission:
- the scope of the project (and especially what comes out of it);
- the management mode (package, subscription, management company) and the costs monitored;
- resource capacity;
- the arbitration rules for the variances between planned and realized;
- the management tool.
These points are the backbone of the project's provisional budget.
Resource capacity
The first step to implementing effective cost management is to plan resource capacity, i.e., identify the resources needed for the project.
Three families of resources are included in the calculation:
- internal human resources : mobilized profiles, seniors, man-days planned by mission phase;
- hardware and software resources : SaaS licenses, equipment, mission expenses, travel;
- external resources : subcontracting, freelancers, partners mobilized on a rare skill.
Each family has a corresponding WJC or unit cost.
Direct and indirect costs associated with the project
The WJC and the ADR of a consultant on assignment include his direct cost and a share of the indirect costs of the service company. In fact, all of the company's management costs will affect the cost of the man-day, and therefore affect the management of project costs.
Some examples of costs that can affect your project cost management:
- the salary of a consultant (and its evolution) is a fixed cost (which can also include variable);
- subcontracting to a freelancer can be a fixed cost or a variable cost;
- the management, HR, IT and accounting of the service company are indirect costs that must also be included in the invoicing.
Let's take the example of a day billed to a ADR €1,200, with and without indirect costs:
| Displayed to quote | 1 200 € | €700 (salary only) | 500 € | 25 000 € |
| Real at Closing | 1 200 € | 900 € (with indirect costs) | 300 € | 15 000 € |
Without taking indirect costs into account in cost management, there is a 40% gap between the expected margin and the realized margin.
Use a dedicated management tool
To carry out this planning work, a dedicated tool will prove to be your ally. Stafiz is an all-in-one solution that includes resource scheduling functionality.
This can help you better estimate your needs and check your resource capacities. You can then anticipate your recruitment plan and can better distribute your resources between your current and future projects.

Step 2: Estimate project costs and build the projected budget
Structure a cost management plan
Preparing a Cost Management Plan allows you to establish:
- the type of project expenses: direct, indirect, fixed, variable, production, material, labour costs;
- the expenses corresponding to each resource;
- stakeholders within the project, who may have an impact on costs;
- the tools used to manage costs.
Two parameters of your project management will then affect this management plan: the frequency of the financial review, aligned with the rhythm of time entry (review at each committee, twice a month or once a month depending on the criticality of the mission), and the planned/realized deviation threshold that triggers an escalation to the project sponsor.
Combine multiple project cost forecasting methods
Once you've determined the tasks, deliverables, and various costs to track in your project management, it's time to estimate them. It is not an exact science. That said, you can gather a certain amount of information and combine forecasting techniques to try to arrive at the most accurate one.
The matrix method. This method consists of identifying the different tasks of the project and determining costs per task. By adding up all the costs associated with each task, you get the overall cost.
The analogue method. This method consists of using the history of previous projects, with a client context and a comparable size. It is fast, but remains unreliable when there is too much variability between the missions studied.
The parametric method. This method is based on the history of the missions, when you have a sufficient set of data to carry out reliable statistical studies: man-days invoiced for a certain type of task, euro reported per end user, additional costs to be expected. This method is risky if the historical project cost estimates are unreliable.
Bottom-up estimation. This method consists of obtaining information from the teams, in the field, whose role is operational. Their experience allows them to give you a more accurate view of the time and costs associated with each task.
Top-down estimation. Top-down estimation focuses on management's vision. This then defines a budget, based on the history available, a benchmark of similar projects and alignment with strategic objectives.
Breaking down the project with the Work Breakdown Structure technique
The Work Breakdown Structure (WBS) is a method of breaking down a project into tasks and subtasks, and then assigning each task to a profile. The project manager estimates the cost of each task according to the CJM, the profile and the number of man-days needed to carry it out, and adds the fixed costs (direct and indirect): premises, subcontractors, service providers.
The Cost Breakdown Structure (CBS) is the tree structure of costs by type of expense. Five positions generally structure the CBS of an advisory orIT Services :
- internal human resources (man-days consultants × CJM);
- subcontracting and freelancing mobilized in addition;
- mission expenses and travel;
- purchases (equipment, materials, one-off services);
- software licenses charged to the project.
The WBS and the CBS together give a two-dimensional view of the project budget: the WBS on the lines, deliverables and tasks, the CBS on the cost items. This dual view gives the project manager a granular view of his costs: seeing, for example, that a phase consumes too much subcontracting, or that a deliverable mobilizes more HR than expected.
However, the WBS + CBS duo requires a fixed timetable and a stable list of deliverables, which makes it difficult to reconcile with an agile method.
Choose the billing method and build the budget accordingly
On a fixed-price project, the selling price is fixed in advance, regardless of the number of days actually consumed. Any production overrun (man-days consumed above the initial costing) is paid to the CJM of the mobilized profile without any invoicing compensation. The gross margin decreases by this difference.
On a direct contract, invoicing follows in principle the days actually produced, which in theory protects the margin. The deterioration happens elsewhere: on the days offered to the customer to preserve the relationship (free corrections, unbilled steering points, light rework). These days are consumed at the WJC without being billed.
On a successful fee mandate, the remuneration depends on the achievement of the deliverable. If the contractual threshold is not reached, it is reduced to the lower limit, regardless of the number of man-days committed. All days consumed in excess of what the lower limit pays are borne by the CJM by the firm.
Anticipate buffer margin (5-10%)
The buffer margin is an envelope added to the initial costing to cover minor discrepancies between planned and actual that appear during the mission:
- 5% of the budget for a mission close to a project already carried out by the firm, with a team experienced in the nature of the subject and a well-defined scope from the time of the quote;
- 10% on a perimeter that is still open with the client, a new technology for the team, or a type of mission that is rarely handled.
This margin absorbs reasonable adjustments: a half-day gap in the estimate of a task, an additional unscheduled customer meeting, a longer framing point.
Beyond a 10% budget to complete the mission, the initial costing was too optimistic. It will therefore be necessary to absorb the discrepancies or invoice an amendment for the current mission, and review the estimation methods for the next estimate.
Step 3: Control costs
The importance of cost control
Cost tracking is a crucial step in good cost management. You need to track and analyze expenses in order to avoid, or at least limit, any overruns.
However, there are regularly discrepancies between the forecast and the actual without this being a cause for concern. In this case, cost control should include an understanding of variances between current and originally planned costs.
To rectify the situation, you need to look for the cause of these discrepancies in order to get to the root of the problem.
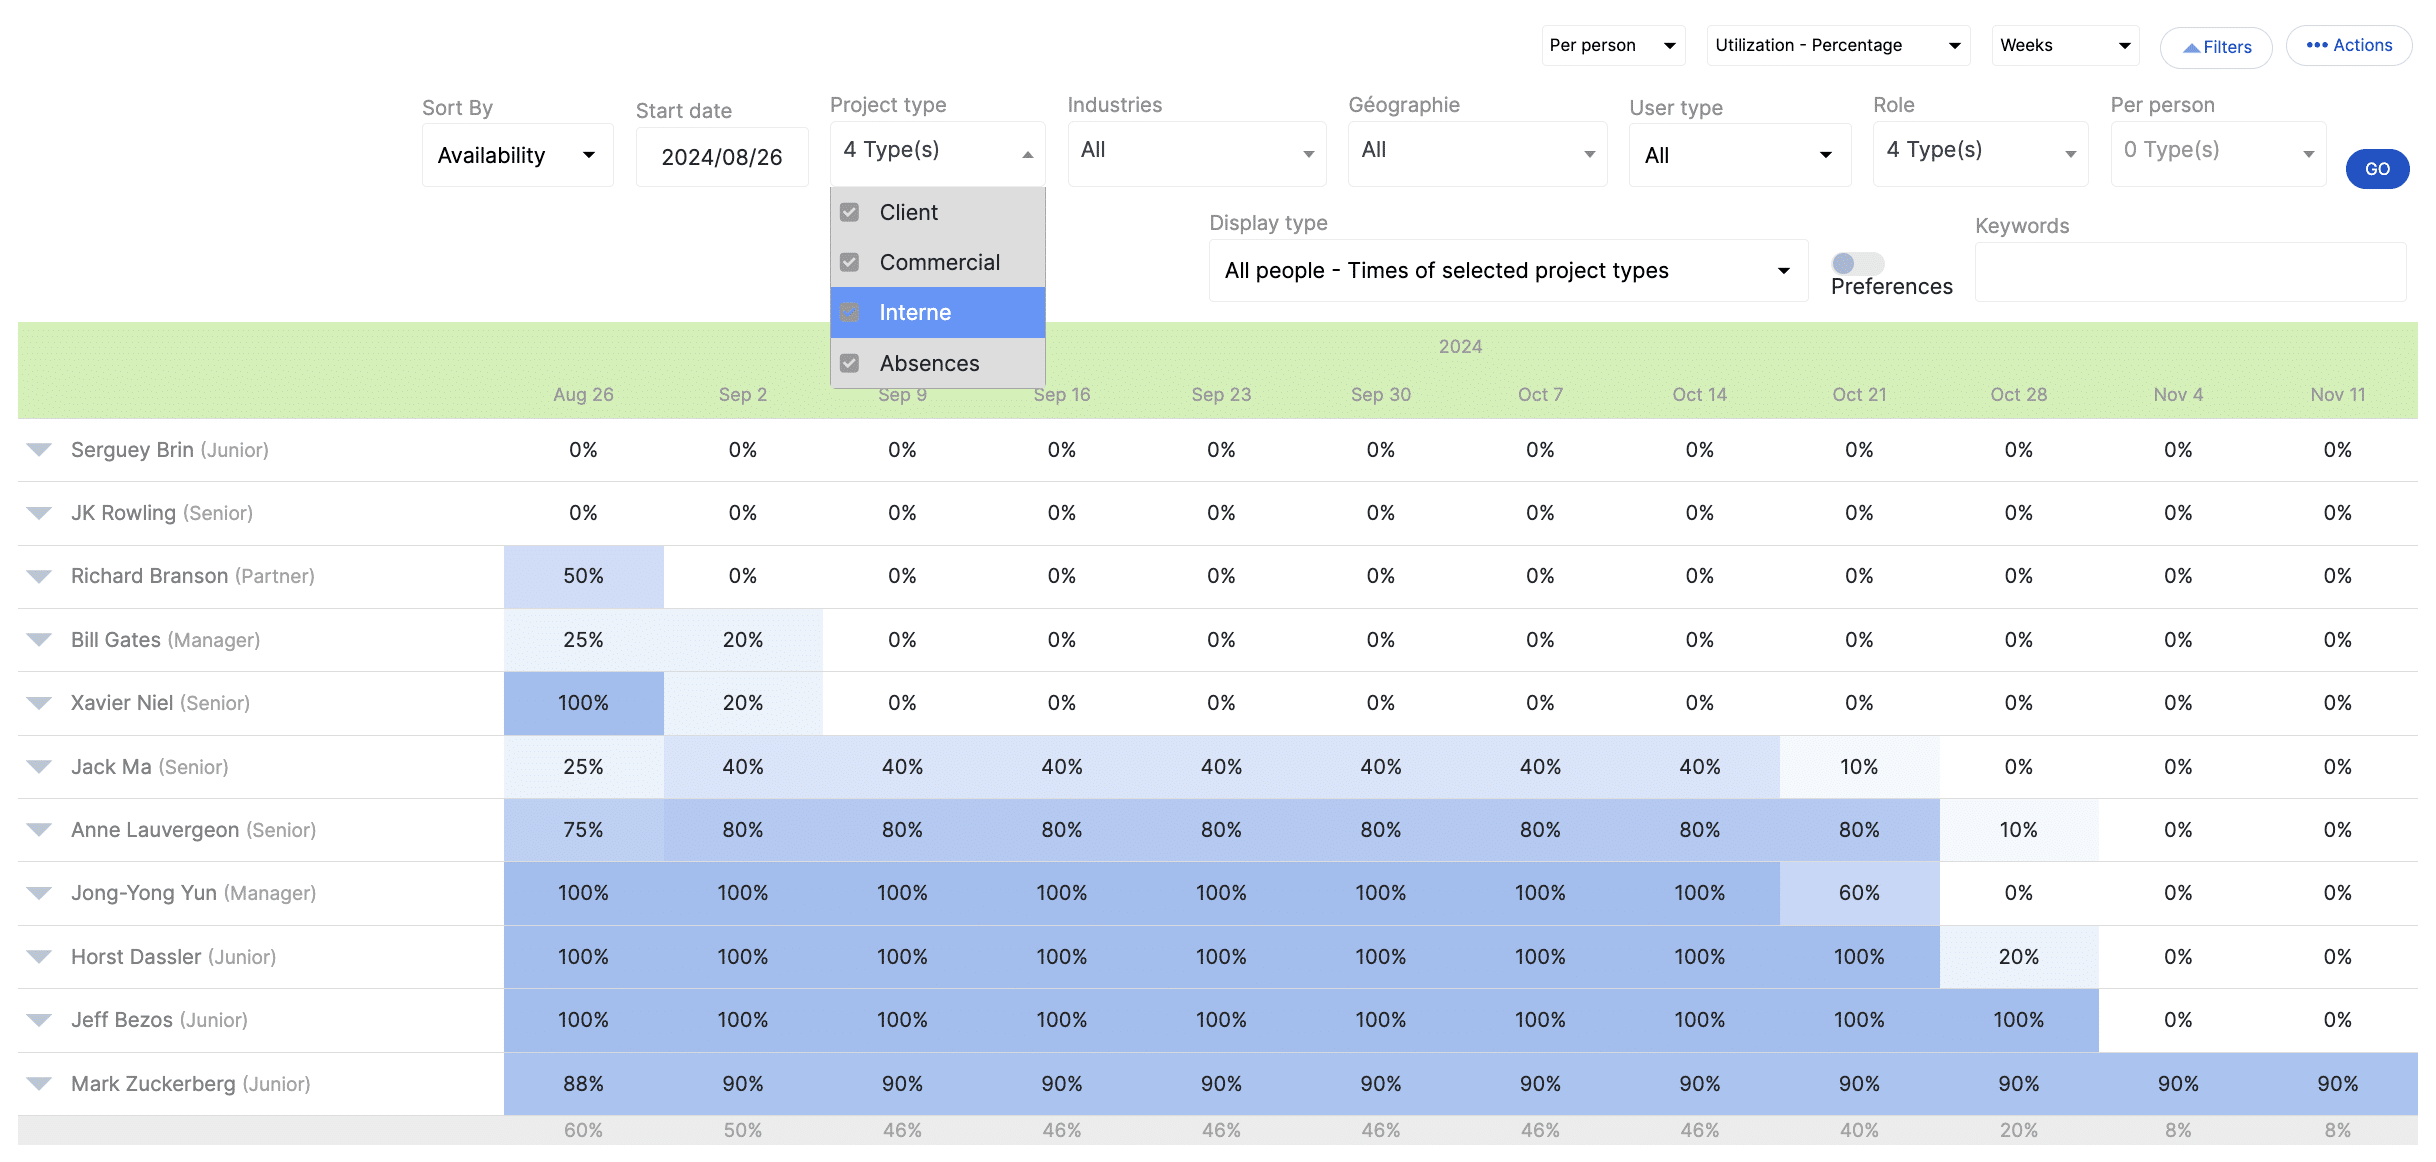
Track billed time (CRA) and unbilled time (billable utilization rate)
Cost control is based on two data streams measured on a daily basis: the time entered by consultants and the monitoring of the intercontract. Each one feeds the steering to a different horizon.
Time monitoring via the CRAs manages the margin of each assignment individually. The project manager uses it to continuously check that the production remains within the envelope sold. Project cost management software consolidates these entries by deal in a dashboard that displays the gap between planned days and days consumed, reports overruns via the progress curve, and drills down by task, team, or consultant in real-time spend tracking. If the entries are irregular or approximate, the dashboard guides decisions alongside the reality of the project.
The monitoring of the intercontract pilot on utilization rate firm-wide consultants. Production management and finance use it to measure overall profitability, independent of a specific mission. An intercontract consultant continues to cost his CJM on his working days, without invoicing in front of him. The utilization rate Global reports the days invoiced to all the consultants' working days. It is the one that measures the profitability of the portfolio, not the margin of an isolated mission.
Analyze the variances between planned and actual
Variance analysis calculates the absolute and percentage variance between the planned cost and the cost committed, based on the planned budget. It then goes back to the root cause of the discrepancy. The earlier the gap is diagnosed, the wider the range of corrective levers remains. To go further, see our guide to analyzing the gaps between planned and realized.
Measure cost performance
The cost performance of a mission is measured by comparing what was planned and what is actually happening at a given time, via these three indicators:
- consumption rate of man-days;
- Difference between expected margin and projected margin;
- Ratio between cost incurred and actual progress (deliverables created, milestones validated).
These indicators give the project manager a sufficient reading for a simple mission. For complex assignments (multi-team, multi-phase, multi-quarter projects), the cost at completion can be supplemented by a synthetic indicator: the CPI (Cost Performance Index), which is based on other indicators:
- Planned Value (PV): the budget planned so far by the initial schedule;
- Earned Value (EV): the earned value, i.e. the total budget spent by percentage of completion;
- Actual Cost (AC): the cost actually incurred up to that point.
The CPI makes it possible to know whether the costs consumed on the project are higher or lower than the value produced by the consultants. Note that this indicator must also take into account whether the project is behind schedule or not.
Use a tool to control costs
As with the previous steps, project cost management software will help you control costs. For example, the dashboard highlights the different key indicators, allowing you to compare them and monitor their progress.
Real-time tracking. Stafiz offers many features to track costs, including real-time expense tracking. By regularly monitoring the discrepancies between the planned and the objective, you will be able to adjust the budget as accurately as possible and optimize your cost planning.
The progress curve allows you to identify cost overruns at a glance:
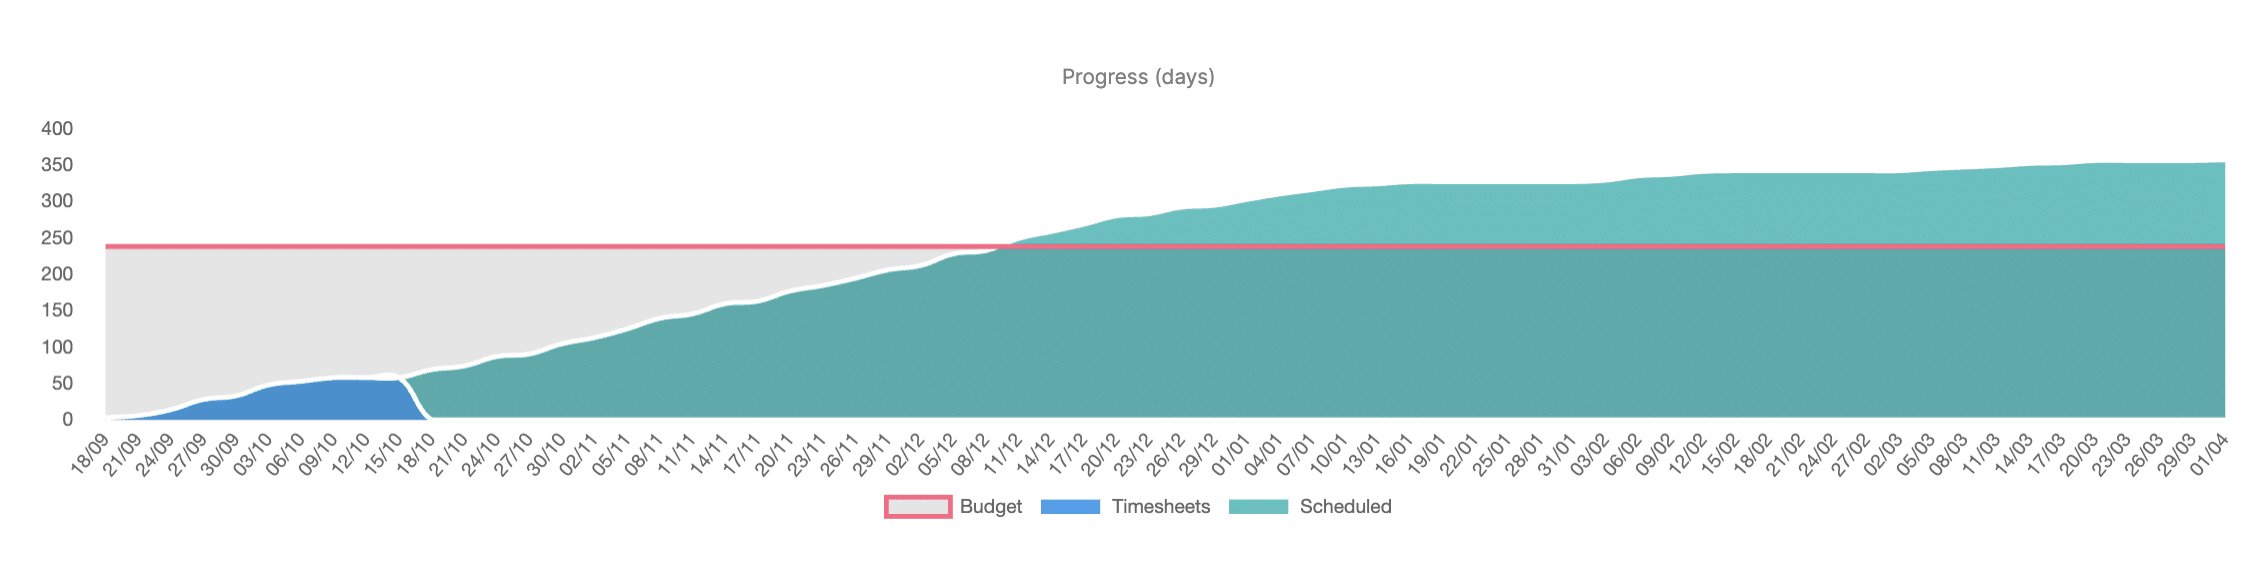
The next step is to understand the reasons for the deviations. Stafiz allows a detail by tasks, teams, geography, person, as well as a view by tasks and phases that facilitate the interpretation of the results.
Tracking costs on landing. Landing cost monitoring is one of the features offered by Stafiz: it consists of collecting past and expected costs in real time to offer an automatic recalculation.
With each change in the data, the KPIs are recalculated in order to offer a version that allows the objectives to be achieved. In addition, you can be alerted in the event of risks of deviations even before they occur.
Identify and correct the causes of overruns
Five causes of cost overruns come up in consulting projects:
- Scope creep accepted without rebilling. Each customer request processed outside of the estimate eats away at the margin without alerting the committee.
- Man-days per profile underestimated in the figures. The discrepancy is revealed at the time of the acceptance or during the extended framing phases.
- Drift of the resource planning. A senior replaced by a junior slows down production; the opposite causes the CJM to rise without real-time visibility.
- Hours not entered in the CRA. Without input data, the dashboard is piloting in the fog.
- Invisible underbilling. Additional services forgotten about the situation, rebillable not processed on time.
These five mechanisms fuel the majority of the main causes of project failure.
Adjust and reschedule
Controlling costs without follow-up is useless. When a deviation exceeds the threshold defined during the framing, you must either:
- reschedule resource planning : change the composition of the team to adjust the average WJC over the rest of the mission;
- renegotiate the scope : re-invoice an amendment or cleanly decode the elements that are not quoted;
- spread out the schedule without adding to the budget: absorbing some of the pressure on time rather than cost.
A fourth choice exists: accept the loss of margin on the mission. It remains valid if the sponsor documents it, provided that it does not become the default output.
Step 4 of cost management: close and report costs
The closing turns the actual margin into a signal for the pricing of the next project. This transformation requires a readable closing report, a comparison between the four margin levels and documented feedback with the sales team.
Produce financial reports
The final step is to prepare financial reports. This allows us to have a written record of the progress of the project, to facilitate decision-making and the preparation of future projects.
This consists of reporting the notable elements, in summary form. Using project cost management tools will make your job easier.
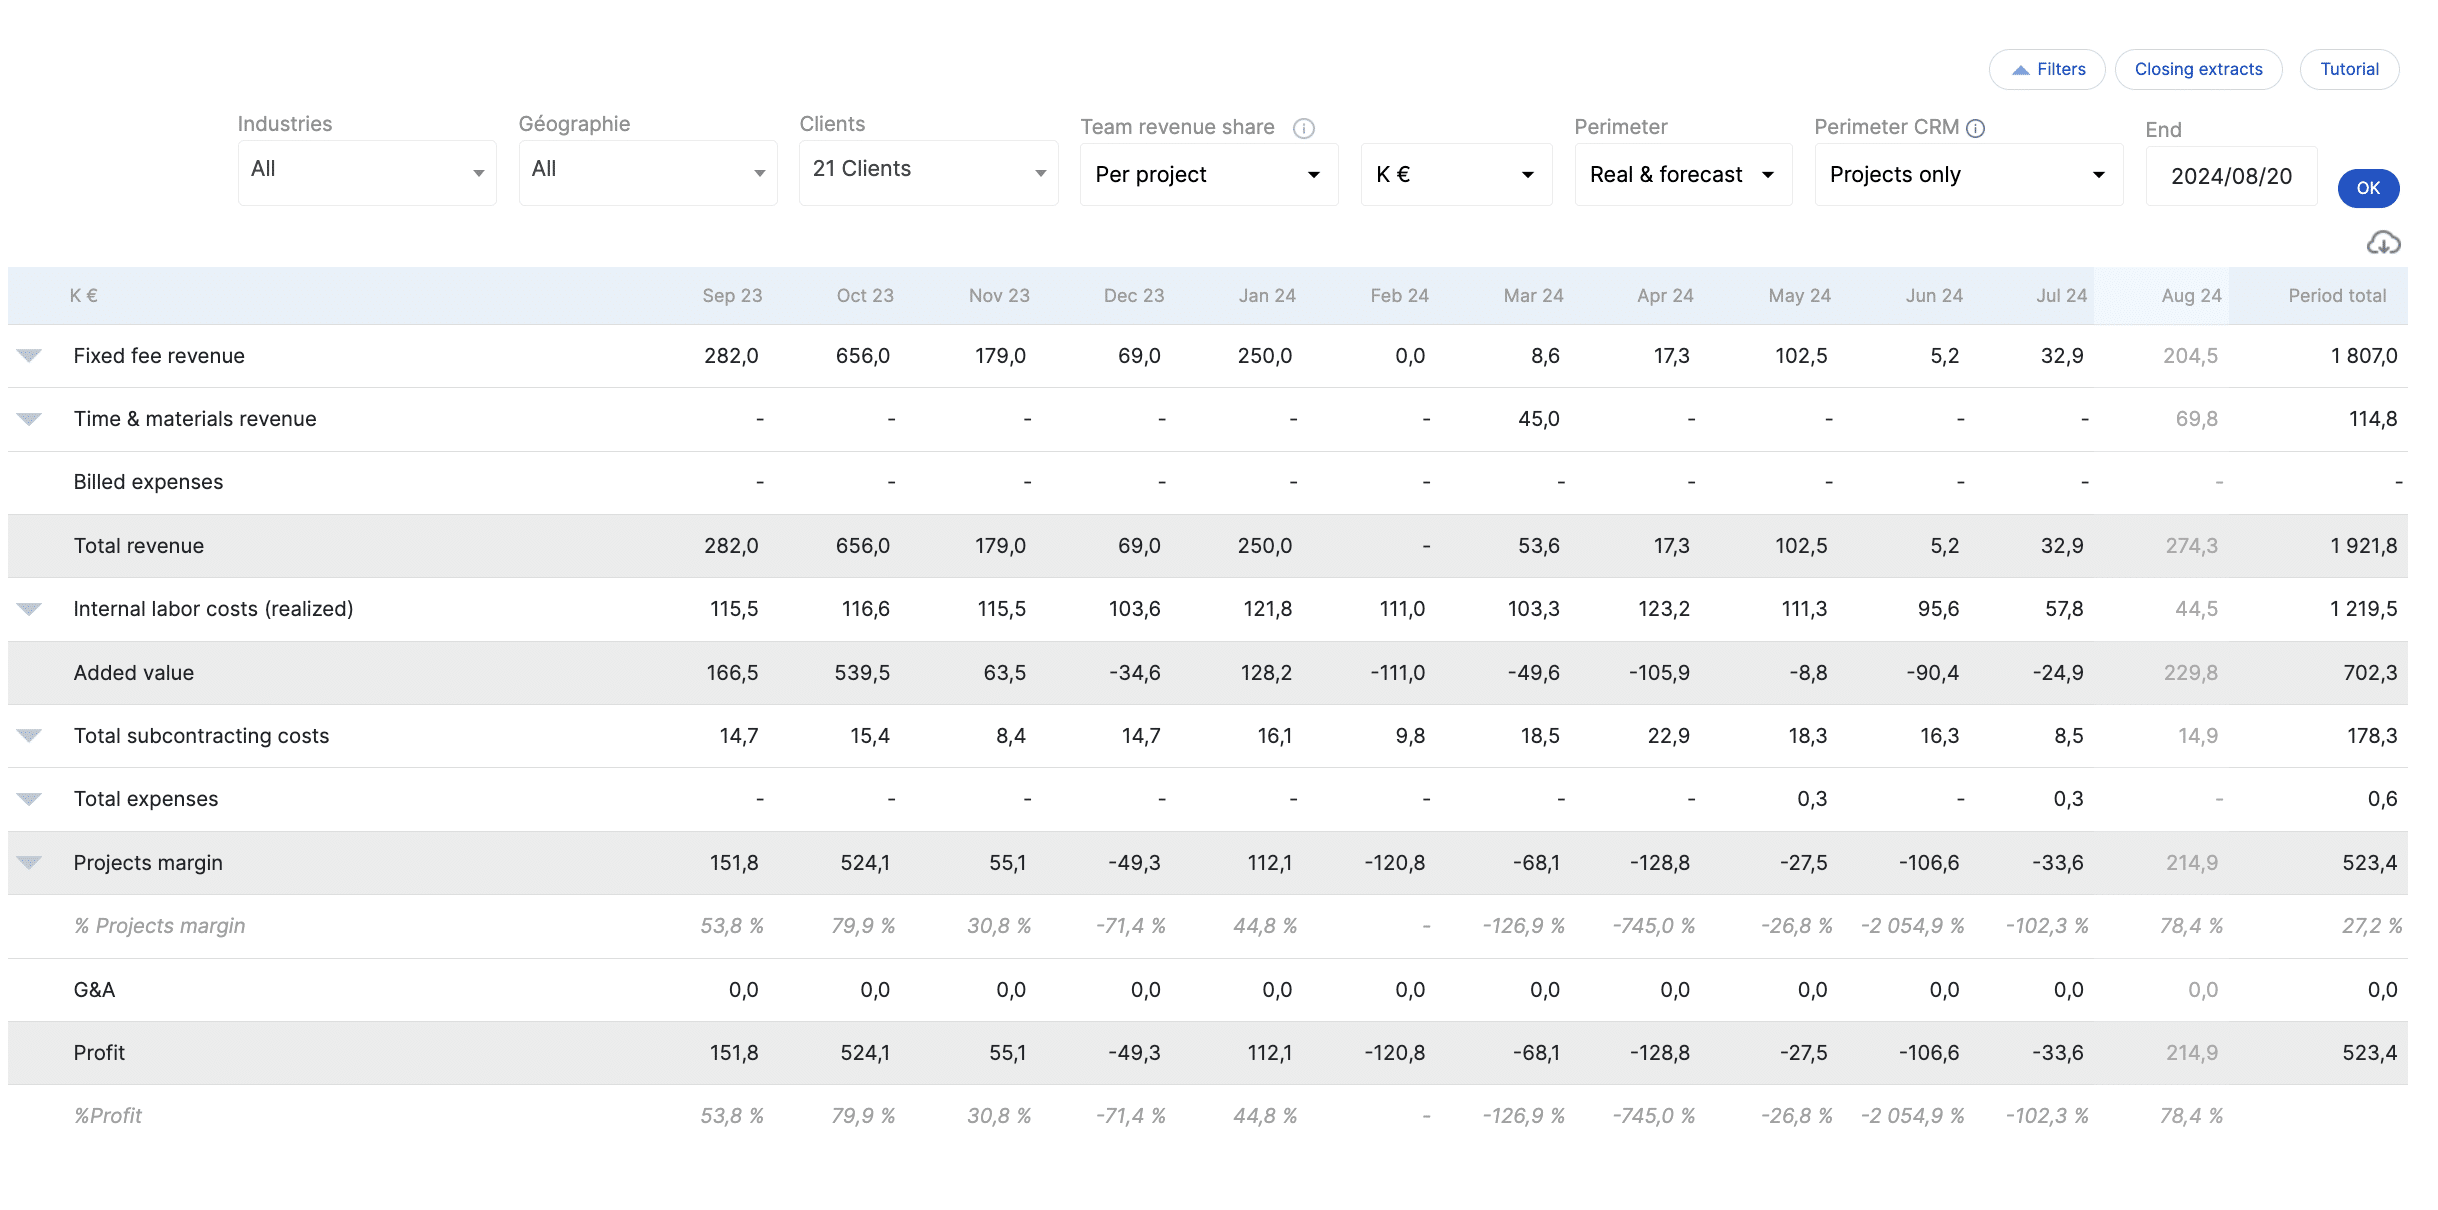
Compare Forecasted Margin, Landing Margin, and Actual Margin
The balance crosses the four margin levels defined in Phase 3. The difference between the expected margin (initial estimate) and the actual margin (post-accounting allocation) measures the quality of the initial estimate. The difference between the landing margin (forecast fixed at the end) and the actual margin measures the quality of management control at the end of the mission. A significant discrepancy on the first indicator refers to the costing, which must be corrected in Phase 1 of the next project. A significant discrepancy on the second indicator refers to the process, which needs to be corrected on the management management side.
Capitalize on the pricing of the next project
Four data from the closed project feed into the costing of the following project:
- the ratio of estimated man-days / consumed by profile calibrates the buffer margin of the next quote;
- the re-invoiced / non-re-invoiced scope differences guide the drafting of contractual clauses (amendments, changes in scope, scope creep);
- the actual CJM per profile on this type of mission adjusts the pricing grid in pre-sales;
- The actual duration vs. planned duration sets the next provisional schedule.
These four metrics feed into the work of optimizing the costs of the next project on measured data.
Stafiz: the cost management tool per deal for consulting firms and IT Services
For the management of project costs, Stafiz allows financial management by project that links resource planning, time tracking and margin indicators in a single system. This unified management covers the scope from pre-sales to invoicing and gives the stakeholders who arbitrate the management of project costs (project manager, production management, finance department) the same real-time reading of current assignments, or even the entire portfolio.
Time tracking and CRA validated in real time. Consultants enter their time from the interface or from the mobile application. The CRAs automatically report to the heads of mission for validation, then feed the indicators for each mission.
Forecast at completion recalculated for each evolution. The cost at completion is updated as soon as a time is entered, an expense is applied, or an amendment is signed. The landing margin follows, and the mission director receives an alert as soon as it deviates from the threshold set during the project scoping.
Consolidated portfolio vision for the production management and the CFO. The utilization rate Overall, the inter-contract by profile, the aggregated forecast margin and the outstanding invoicing are displayed for all the firm's assignments, without manual aggregation.
Multi-project history for the CJM grid and future pricing. Each closed mission enriches the history that can be used for the next costing: ratios of estimated / consumed days per profile, actual margins by type, effective versus planned durations.
Integration with existing accounting tools. Stafiz connects to Sage, Cegid and other accounting software to automatically feed project accounting and avoid weekly manual exports.
Frequently asked questions:
Project cost management follows the budget of an assignment from the quote to the accounting close. It includes man-days, subcontracting, costs and purchases. In a consulting firm or IT Services (digital services company), it protects the expected margin and feeds into the pricing of subsequent projects.
Four phases recognized by the PMI: framing the cost management plan and setting alert thresholds, estimating and building the provisional budget, controlling the costs during execution via the FAE and the CPI, closing and capitalizing for the next project. In a consulting firm or IT Services, each phase is articulated with the sales cycle of an assignment.
Four estimation methods: analog (comparison with a similar past project), parametric (statistical ratios per feature or per deliverable), bottom-up (task-by-task aggregation from the WBS), top-down (overall envelope set by management, broken down by phase). In Council and IT Services, bottom-up and parametric remain the most commonly used to estimate the costs of a project.
At the enterprise level: sales − fixed costs − variable costs = target net revenue. At the level of a board orIT Services : sales price − direct costs (man-days × WJC) − allocated indirect costs = project gross margin. This formula serves as a reference to monitor forecast, forecast and landing margin over the course of the mission.
Cost control monitors and arbitrates discrepancies during execution. Cost reduction decides to reduce a specific item: outsourcing, automating, renegotiating. Cost management covers the entire process over the four phases (framing, estimating, controlling, capitalizing). In Council and IT Services, control is operational during the mission, reduction is strategic for the structure, management encompasses both.
Four levers limit overruns: framing the scope and the Cost Management Plan, entering the CRAs every week to have reliable data, monitoring the FAE in real time to identify drifts before a 5-point margin difference, and re-invoicing as soon as a customer amendment is signed.