
Updated June 8, 2026
A consulting mission that gets out of hand is rarely seen in time. The CFO discovers the real margin at the close, when the man-days have already been used up and the invoicing is frozen: too late to correct. However, it all came down week after week on a simple and rarely tracked gap: the difference between man-days sold and days actually consumed. The progress report should be the instrument that makes this gap visible early enough to react. Too often, it is limited to a reassuring statement that does not put a figure on the budget consumed or the milestones that are overdue.
A useful progress report continuously compares the planned and the realized, on the schedule as well as on the budget, so that the project manager and the steering committee can arbitrate before closing. It is a recurring progress report (weekly internally, presented to each committee on the client side) that tells where a project really stands: what is delivered, what remains, gaps, risks. This article details how to build it so that it can be used to decide: definition, 6-step method, numerical example and best practices.
🔎 Key elements to remember
- A project progress report (or progress report) compares the actual progress of a project to the planned and is used to decide, not just inform.
- Three measures not to be confused: physical progress (deliverables), budget progress (man-days consumed over sold, which drives the margin), contractual progress (invoicing milestones).
- The signal that counts: the planned/realized deviation. 70% of the time consumed for 50% delivered, and the margin melts away.
- Seven sections: title/period, weather, summary, milestones, schedule and budget variances, risks and actions, action plan.
- Cadence: weekly internally, to each committee on the client side.
What is a project progress report?
Progress report: definition
The project progress report is a short, recurring document that compares the actual progress of a project to what was planned. Sent at regular intervals, it summarizes the status of the project, announces next steps and highlights risks. It answers three questions: where do we stand, where should we be, and what do we decide accordingly.
It is not only aimed at the operational team: everyone involved in the project, from contributor to sponsor, is the recipient. To be read, it remains concise and structured.
Internal report or committee report: two uses
The frequency of distribution of the report depends on the duration and criticality of the project: daily on a short or crisis project, weekly in most consulting missions, monthly on a long program. But it is above all the reader who changes everything, and the same project feeds two different relationships:
- the internal report, intended for the team, goes down to the operational detail and serves to coordinate the week's work: who does what, what priorities, what sticking points to be removed;
- The committee or client report is a decision-making summary: less detail, discrepancies put into perspective, and a recommendation for arbitration (continue as is, adjust the scope, strengthen the resource planning or alert the customer).
The risk, in practice, is to get the version wrong: a committee drowning in operational detail drops out, and a team that only receives a smoothed summary loses the information it needs to move forward. Hence the interest in adapting the report to its reader.
How to calculate the rate of progress of a project?
Establishing an accurate rate of completion is tricky, but visibility into the distribution of the resource planning compared to the initial schedule already gives a good estimate. The Stafiz project management software offers time monitoring that allows real-time calculation. Advancement is calculated on the number of days (or hours) already completed in relation to the total of the mission; 100% of the mission is normally completed. Two methods coexist:
- Compared to the realized (or resource planning): the total number of days is the sum of the days already completed and the resource planning still to be planned. This is the most up-to-date view of progress.
- Compared to the production plan : The total is that of the original plan. A rate of 110% indicates that you have already consumed 10% of too many days, and that it must be stopped quickly.
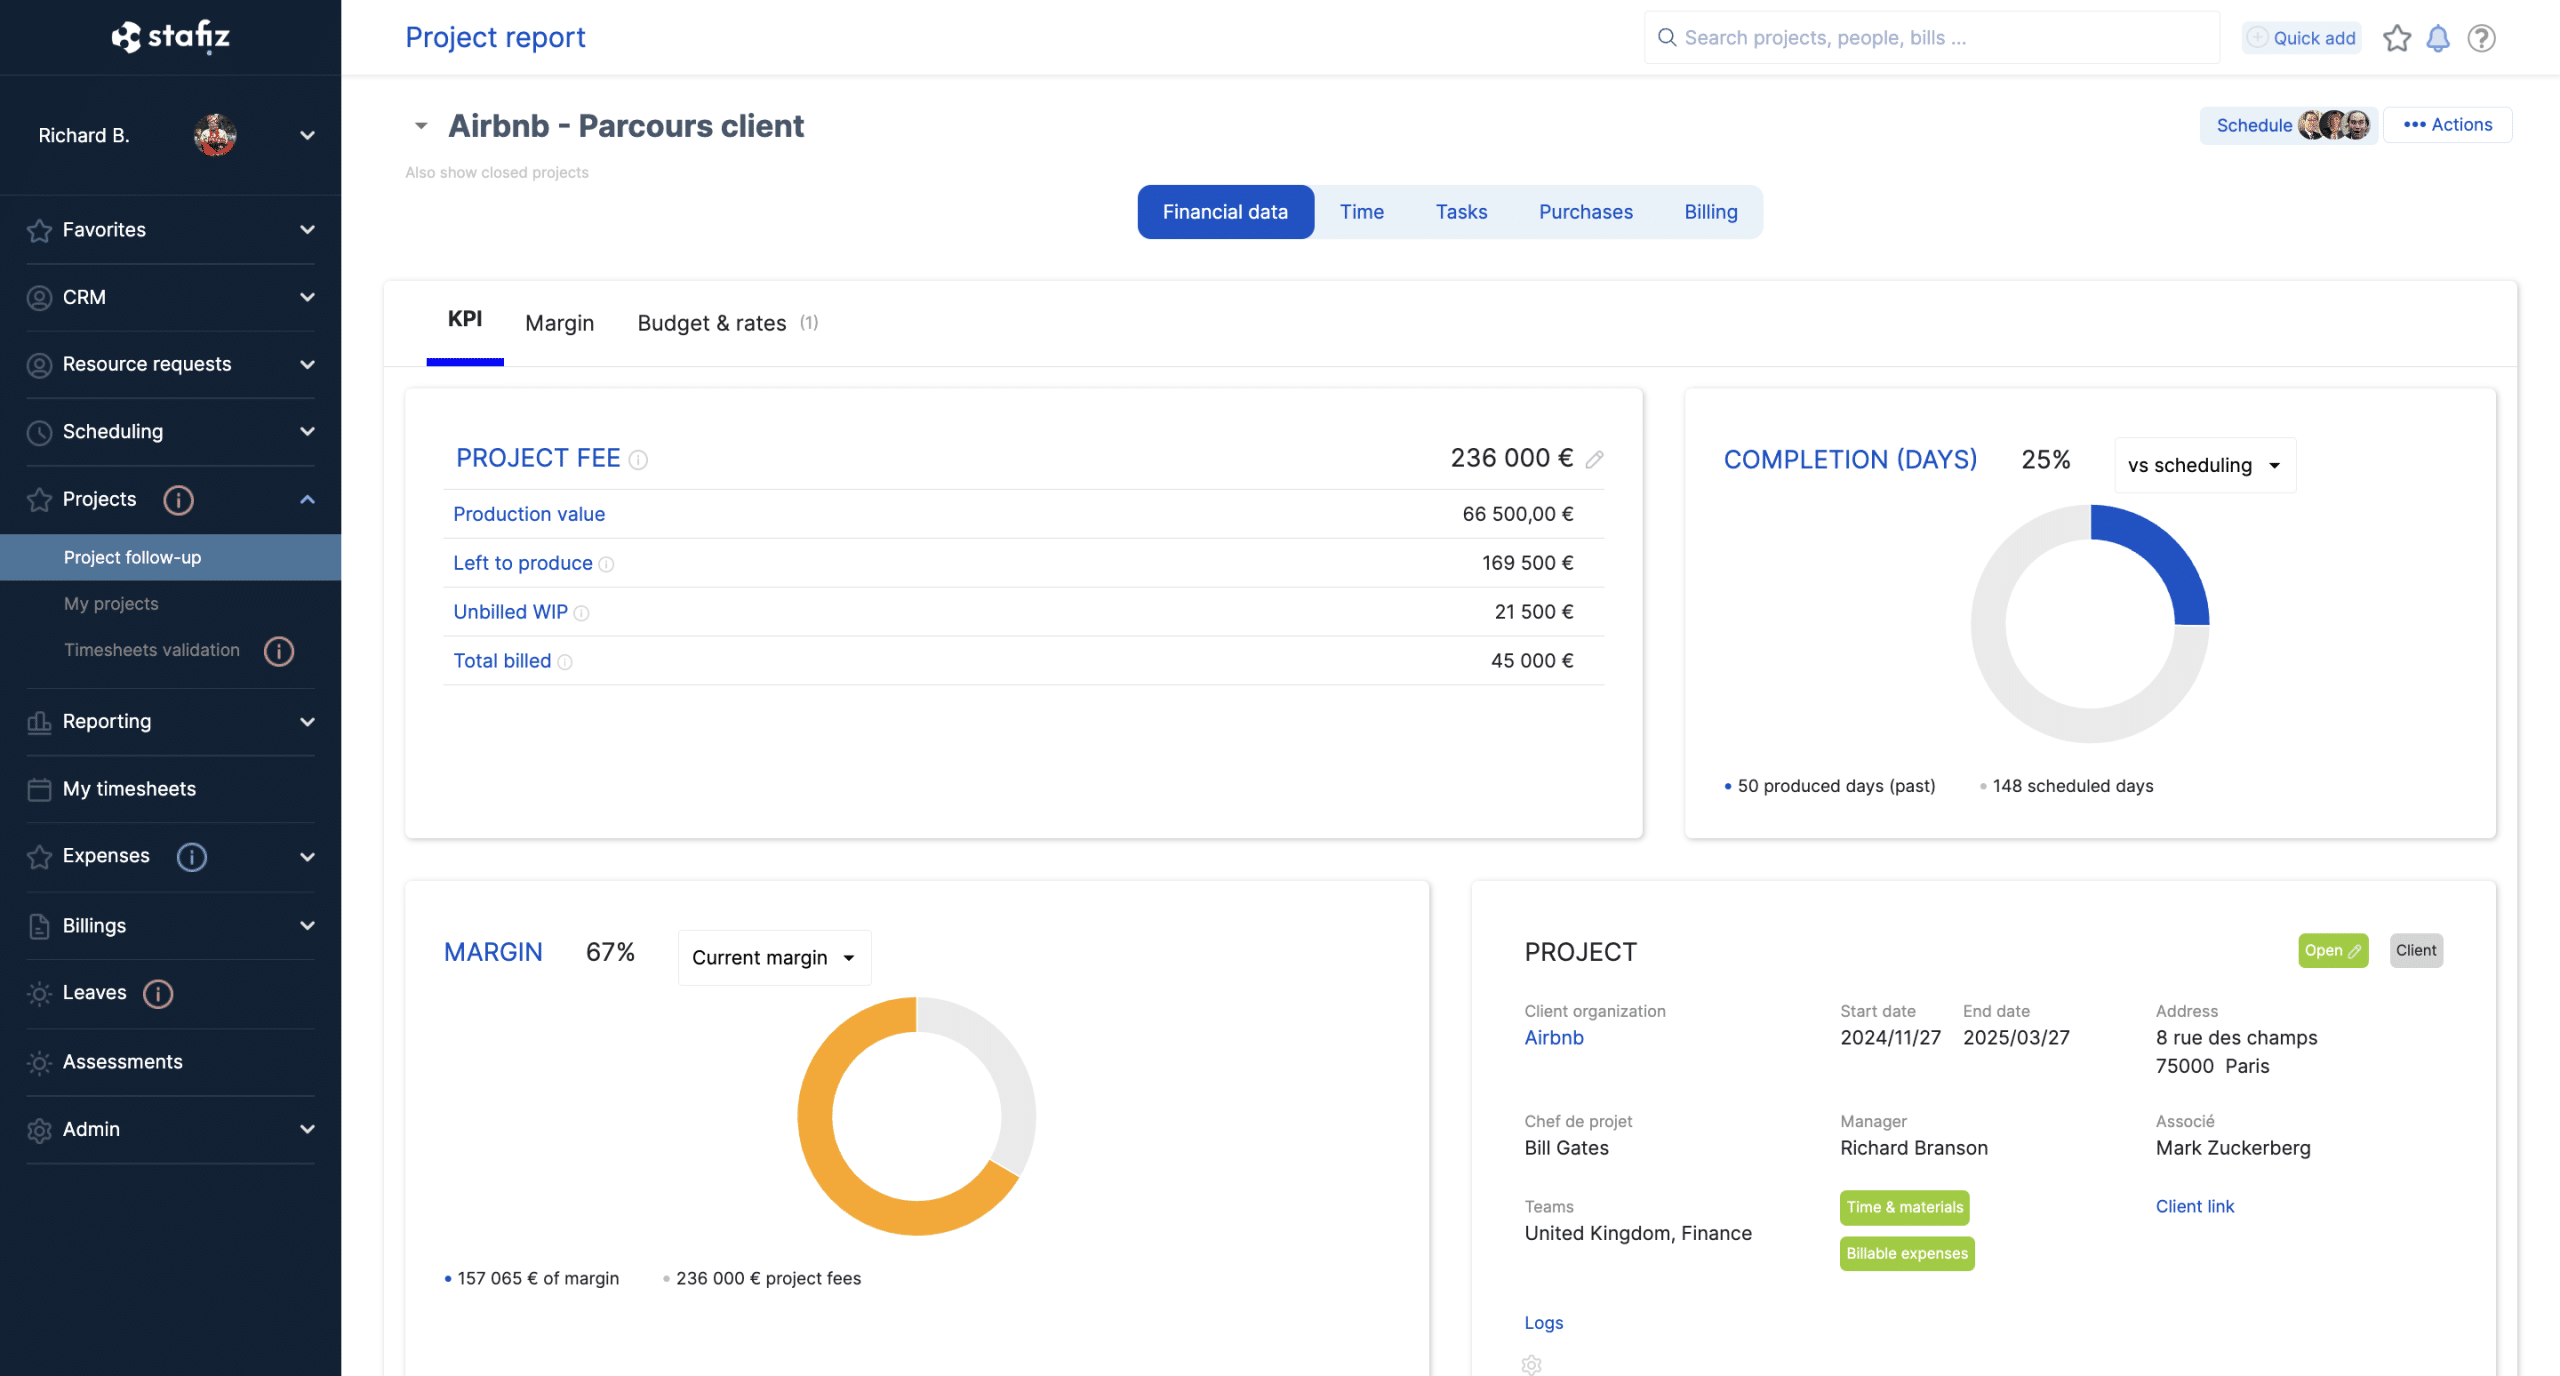
In Stafiz, the rate of progress of a mission is calculated in real time from the times achieved and the production plan.
The three measures of advancement not to be confused
The above rate measures only one thing: the time consumed. To manage a service mission, the project manager and the CFO need three separate progress measures, because they often diverge and one is not enough to decide. "The project is at 70%" only makes sense by specifying what progress we are talking about:
- Physical advancement : the share of deliverables or milestones actually produced. Several methods allow us to estimate it without lying to ourselves (equivalent unit, intermediate milestones, 0-100 or 50-50 rules, task weighting).
- Budget progress : the man-days (or the budget) consumed compared to the planned. He is the one who drives the margin at completion.
- Contractual progress : the billing milestones reached, i.e. what can be invoiced to the customer.
The trap lies in the gap between these three measures: 70% of the time consumed for 50% delivered, and the margin deteriorates silently. Only the planned/completed reconciliation reveals this.
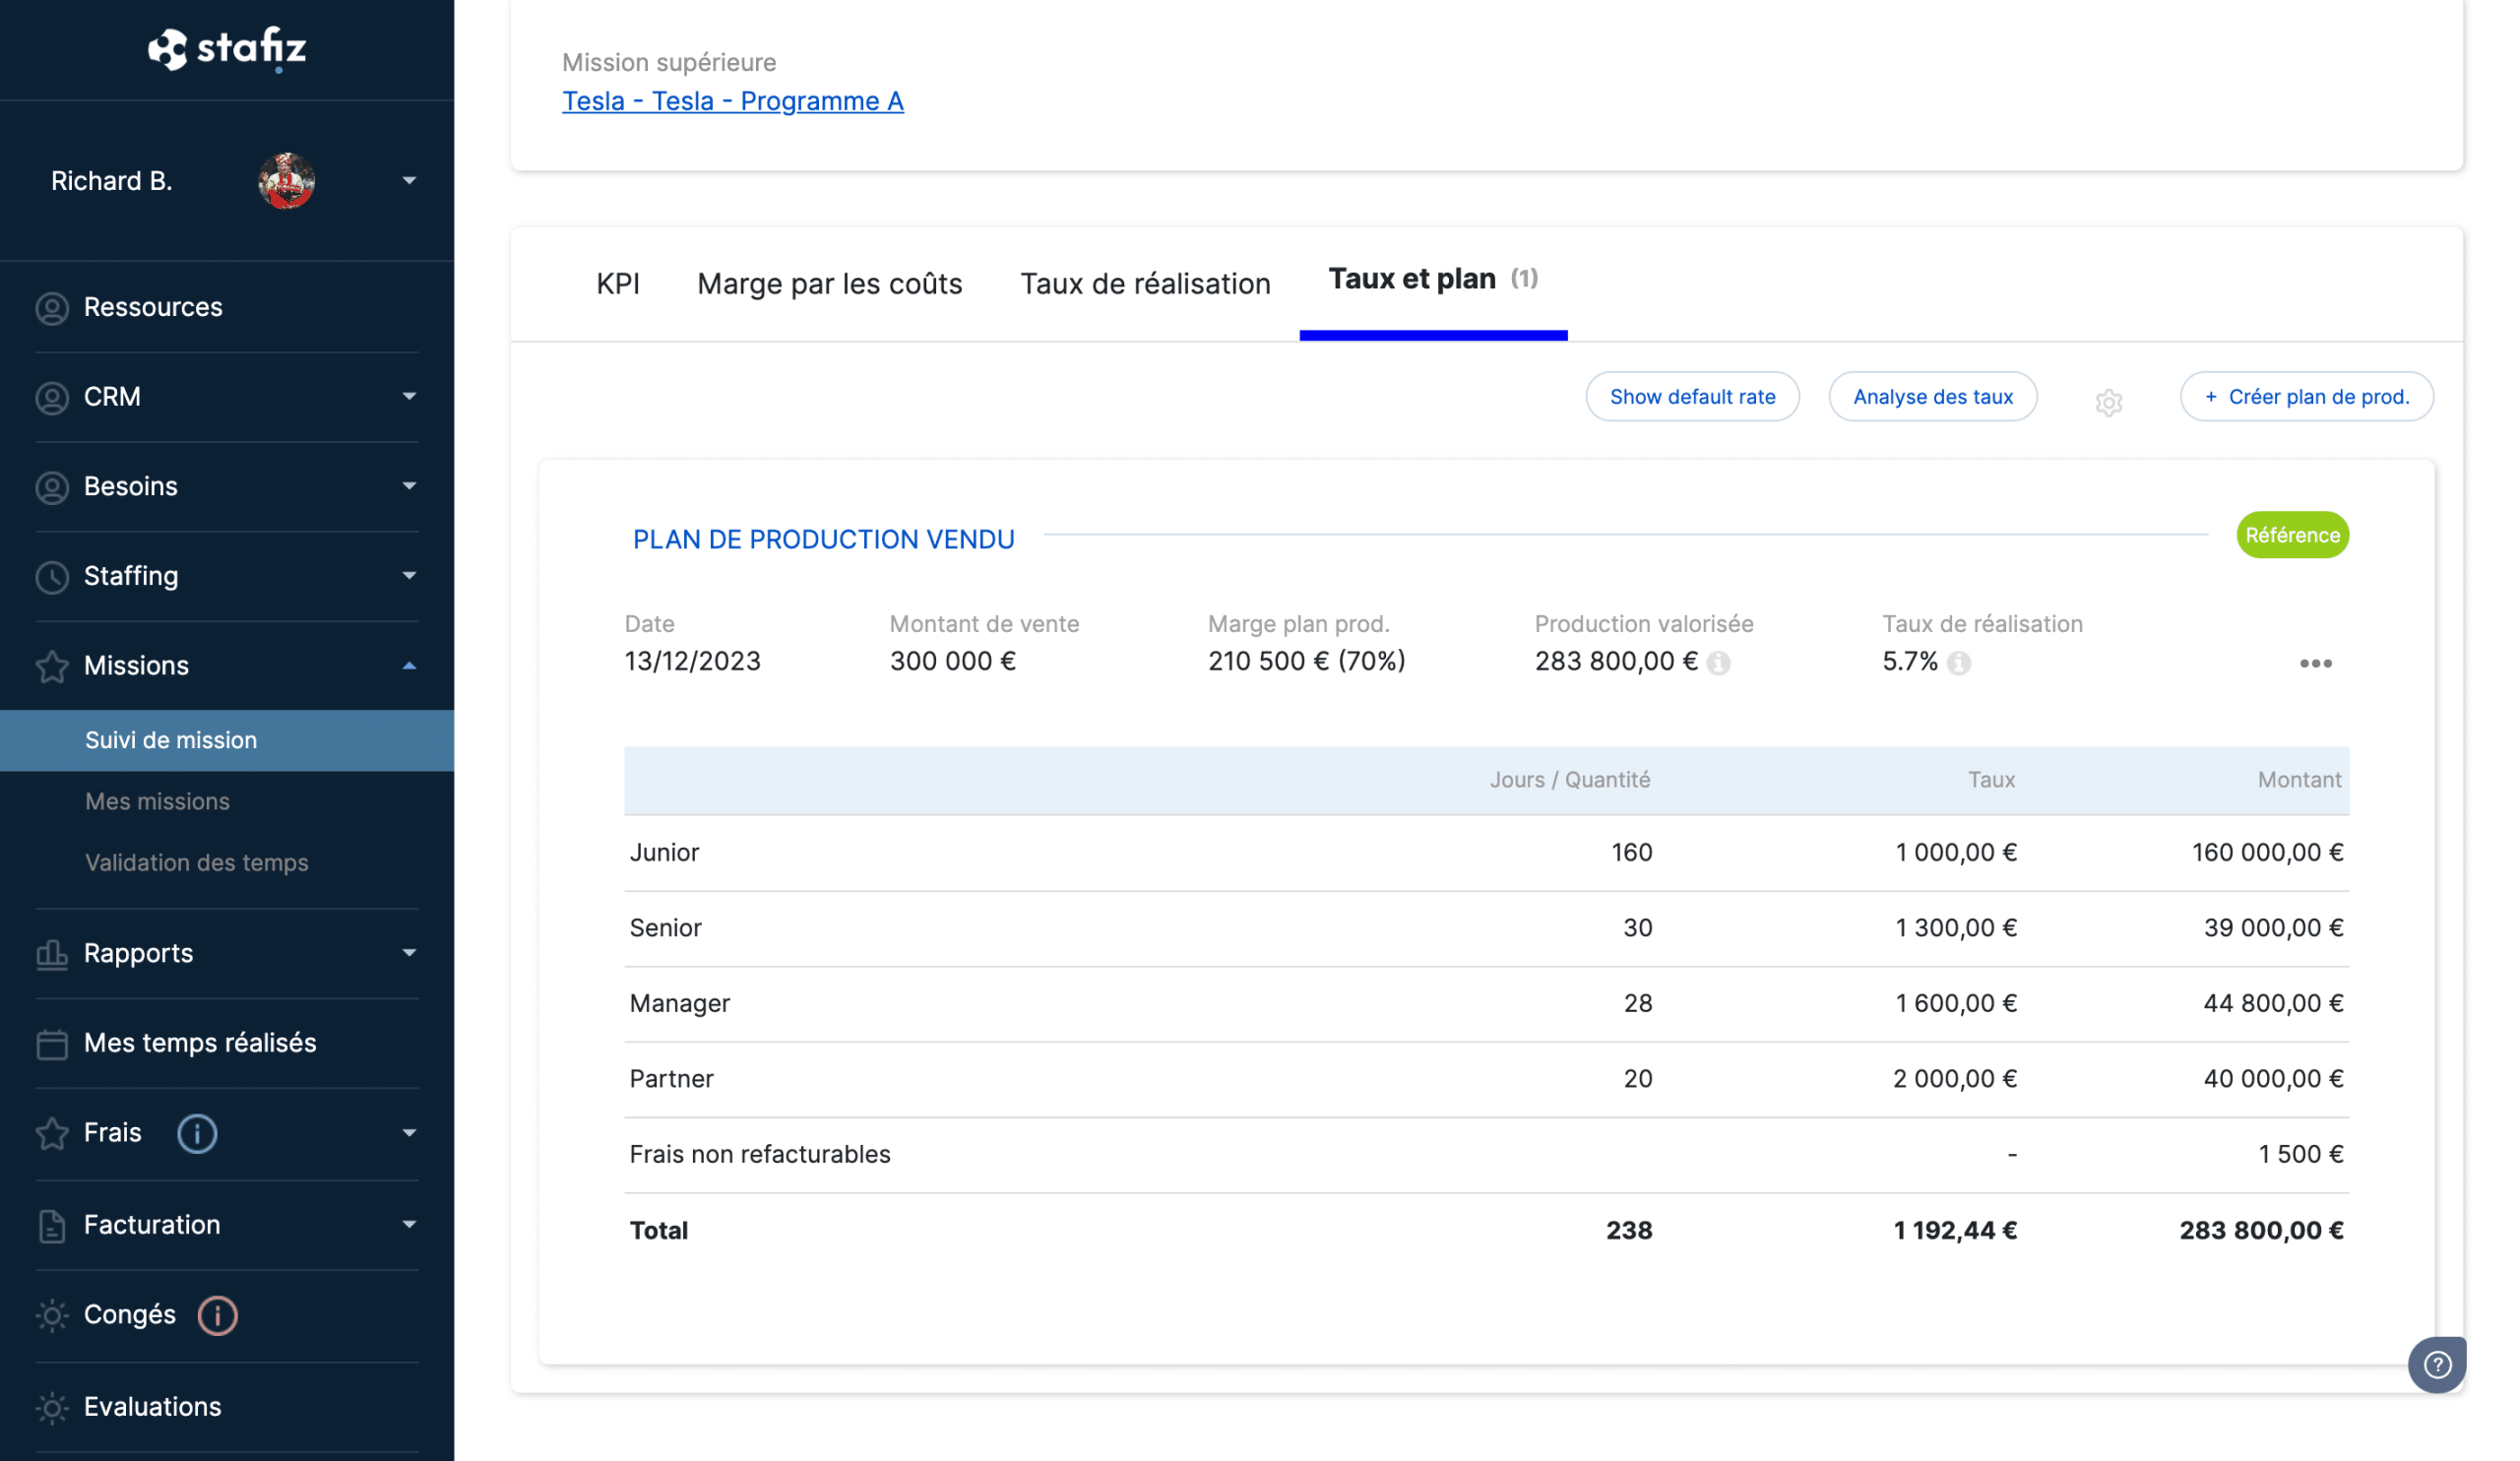
In Stafiz, the production plan of a mission displays the projected margin and the completion rate: this is the budget progress, the one that drives the margin at completion.
Why is project status important?
The progress report serves four functions. Only one justifies really forcing ourselves to do so: allowing decisions to be made in time.
To inform the teams
Its primary objective is for each employee to know what has been achieved and what remains to be done. Generated from project management software, it centralizes information and ensures a uniform level of knowledge for the entire team, with no unofficial version circulating in parallel.
To monitor the progress of the project
Project monitoring is a condition for its success. The progress report requires a regular step back: it records progress, situates the project in relation to its trajectory and brings up weak signals before they become problems.
To be proactive in the event of deviations
This is the function that matters most. In a service company, two discrepancies weigh on the margin: the provisional budget which drifts when the parameters change during the mission, and the gap between the time spent and the time invoiced. Analysing what has been achieved in relation to the forecast reveals these threats (budget overruns, delays in deliverables, scope drift) while there is still time to act. Mentioned in the report, these discrepancies give the project manager and the CFO something to arbitrate: adjust the scope, strengthen the resource planning, replan. Without this numerical reading, the drift is discovered at the closing, when it has already cost.
To facilitate asynchronous work
Consolidated follow-up limits information meetings: everyone has the essentials asynchronously, and only high value-added meetings are maintained. On remote teams, the regular report maintains the link and leaves a written record of decisions.
How to write a project progress report: the 6-step method
- Define a standard with the team. Install a reusable template (fixed sections, project naming nomenclature and date) at launch and build it with those who will read and feed it. A stable format makes the report predictable, quick to produce and comparable from one edition to the next.
- Recall the context. In a few lines: why the project exists, its scope, its objective and the roles of each person. An occasional reader must be able to find his way around without reopening the specifications.
- Summarize the key points. A few bullet points on what has progressed, what is blocking, what is coming. This is the part that those who read only this will read: it must be enough to understand the status.
- Measure progress. The three rates seen above (physical, budgetary, contractual), with the forecast/actual quantified variance, not an assessment. This is the decision-making heart of the report.
- Take stock of the schedule. Milestones achieved, remaining milestones, upcoming deadlines and sticking points compared to the initial schedule.
- Discuss the risks and conclude with the action plan. Each risk associated with the action that contains it, then the action plan: who does what, for when. Transparent without being alarmist.
Mistakes that make a progress report useless
- Announce a percentage without specifying its base. "The project is at 70%" does not say whether it is the deliverables produced, the time consumed or the milestones invoiced. Without an explicit basis, the figure is wrongly reassuring and masks a drift in margin.
- Drowning the reader. A report of several pages is not read to the end. The essential (status, deviations, decisions) fits on one page; The details are attached or linked.
- Inform without giving a decision. A report that lists the activity without quantifying the planned/actual variance does not trigger any arbitration: the committee takes note, but does not correct anything.
- Work on hand-reconstructed data. Consolidated in a file on Friday evening, they are already false on Monday. Steering on the basis of overdue figures means deciding on the past.
- Glue a Raw Gantt. Illegible out of context, it gives an impression of seriousness without saying anything about the real state or the risks of the project.
- Smooth out the bad news all the way to the committee. A risk revealed too late is no longer a risk, it is a problem. The report serves precisely to raise them while there is still room for manoeuvre.
How do you present the project progress?
Define key progress indicators
Success is measured by criteria set upstream, at the preparation of the project, and translated into indicators. The most common in a progress report: completion rate, occupancy rate, Rate of resource planning and the Time Performance Index. To learn more about choosing the right metrics, see our guide to project management KPIs.
Milestones provide the simplest benchmark for progress: at the crossroads of tasks and stages, they mark the key points of the project, the sending of specifications or the validation of a phase. Clearly indicating those who are crossed helps everyone to visualize what has been achieved.
Weather status and milestone trend
For the summary, a traffic light weather status (🟢 on rails, 🟡 vigilance, 🔴 alert) is better than a paragraph: the reader grasps the general state at a glance, then goes into detail only the phases that are problematic. On a portfolio, the colour code even makes it possible to filter out projects at risk. Two conditions for it to be really useful: apply a simple and constant coloring rule from one report to another, and keep the color history, which reveals a slow degradation before it turns into an alert.
Milestones deserve the same treatment on long projects. Rather than a list of dates, each milestone is recorded as its expected date and its date reassessed with each report: the resulting curve (milestone trend analysis) shows whether a milestone is slipping week after week, and therefore whether action is needed before it falls.
Choose a visual format
The format is not a detail: it decides whether the information is read and understood. A report adapted to its audience gets the message across; Sometimes a simple structured email is enough, and on a portfolio of assignments , a dashboard gives the quickest overview.
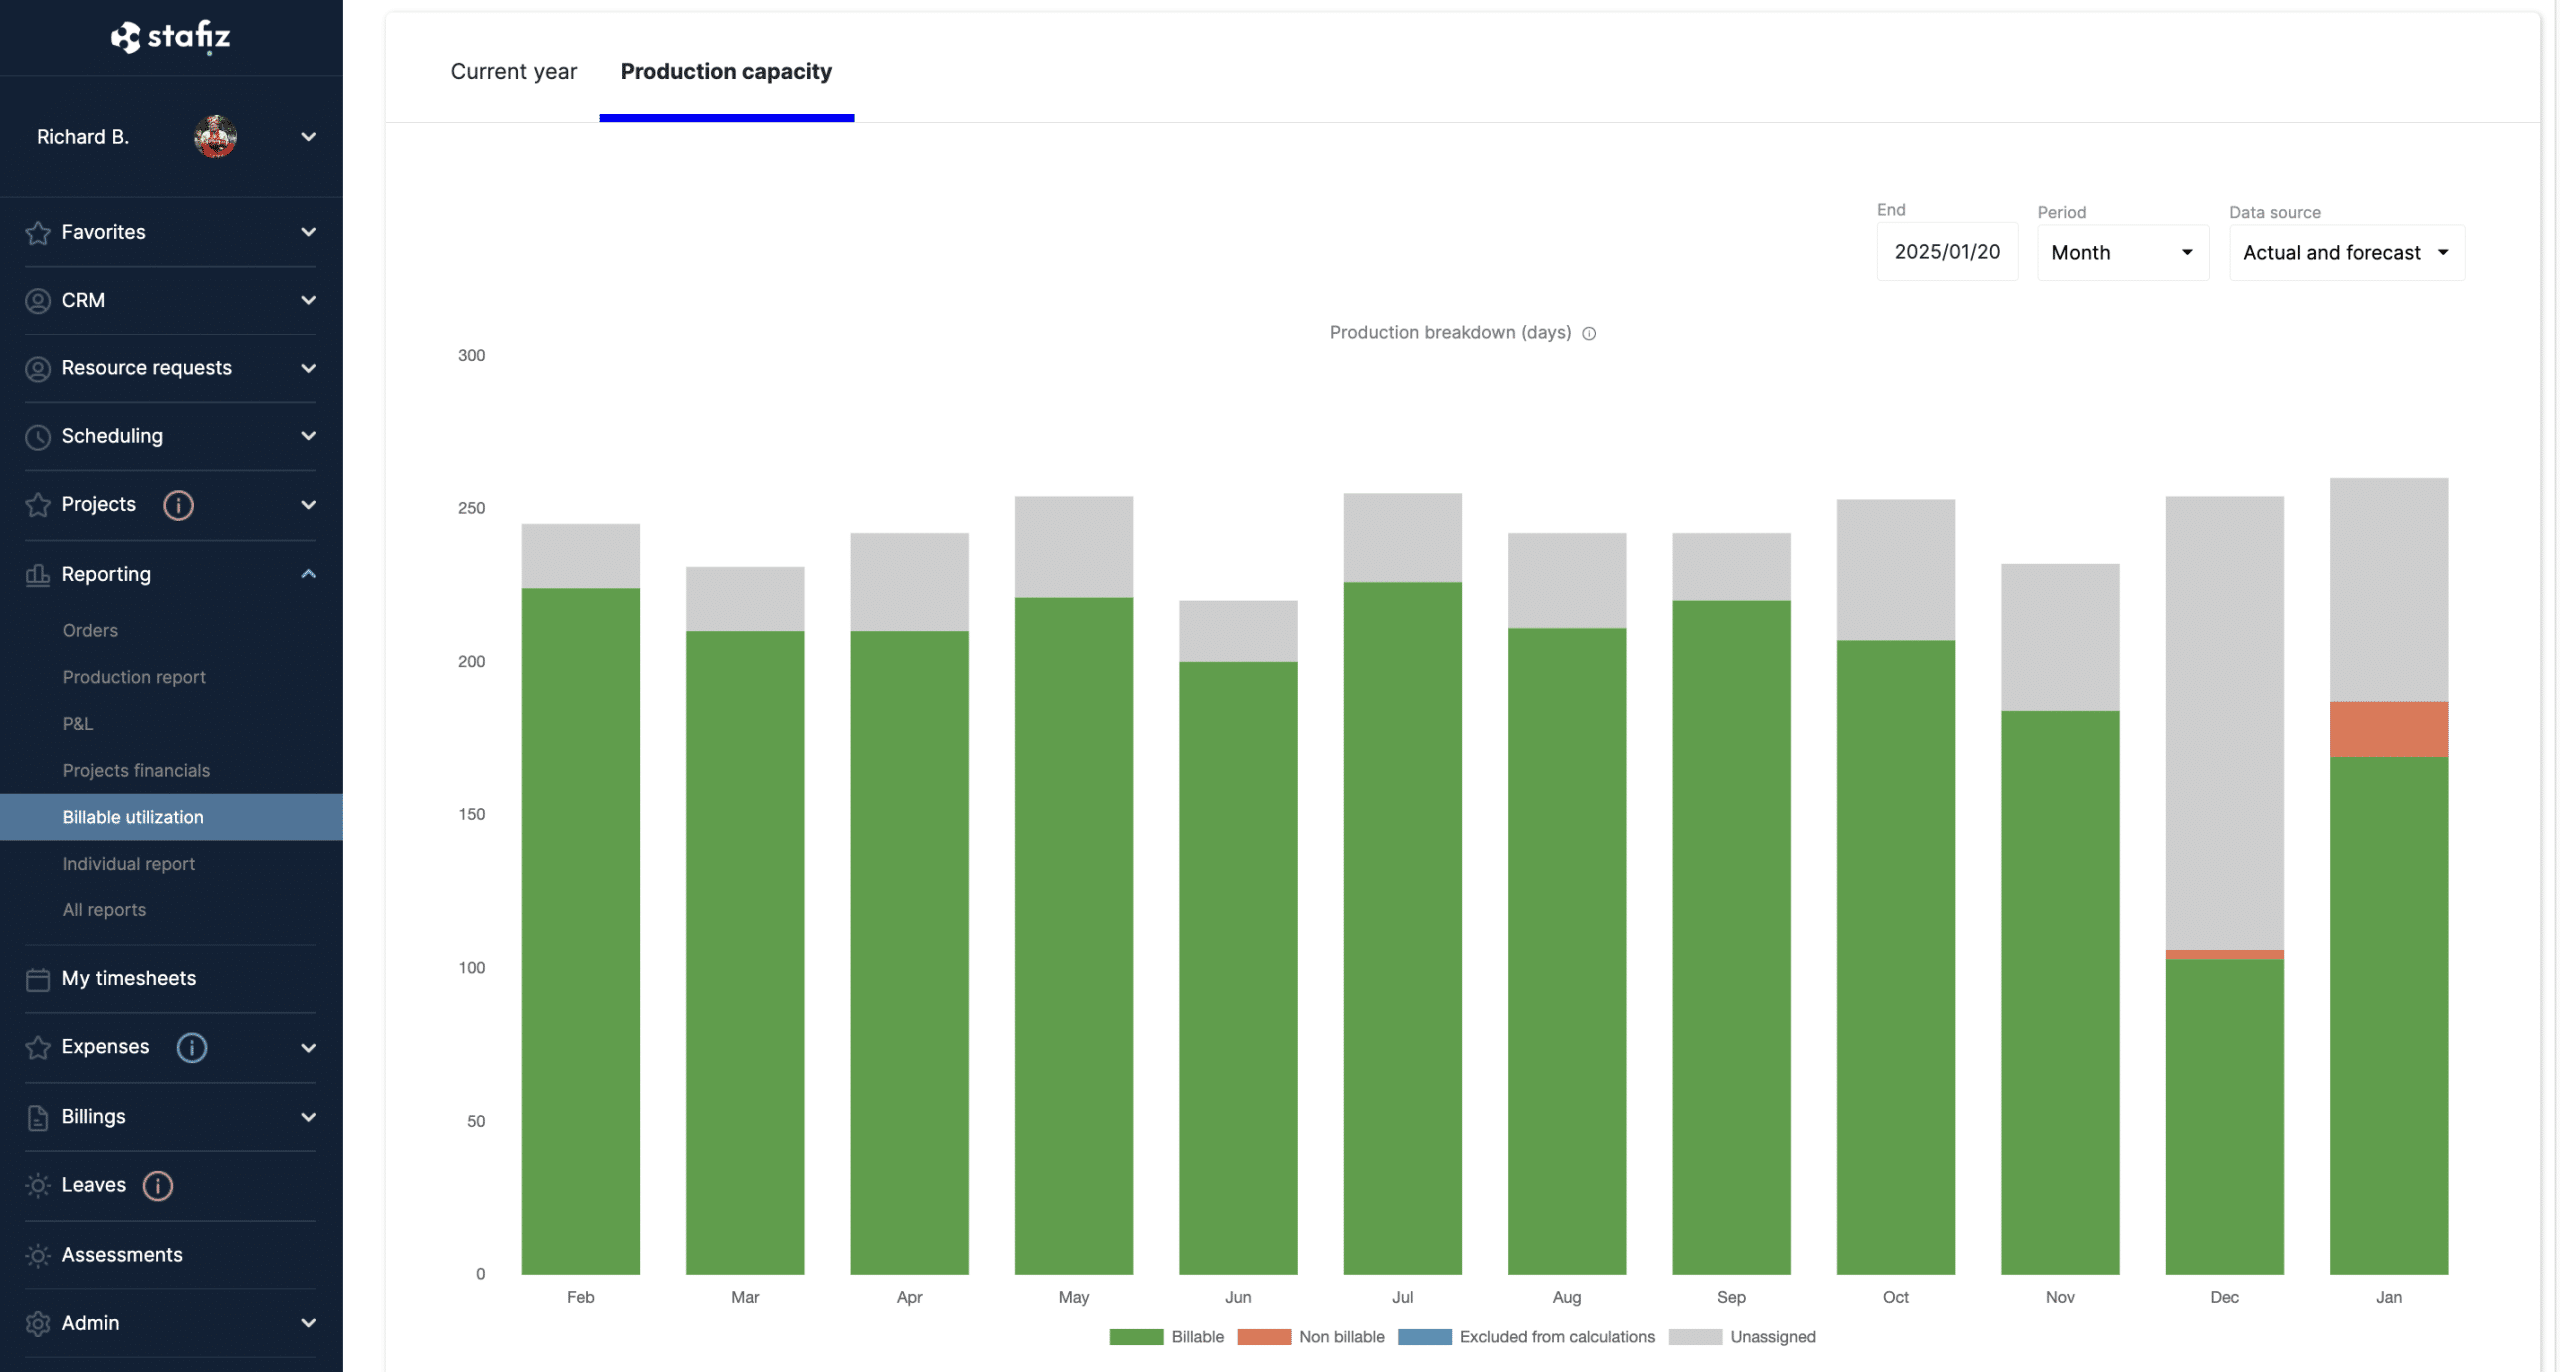
The utilization rate (production capacity) in Stafiz reporting: an example of a synthetic visual format, more readable than a long commentary.
Three benchmarks from the most effective practices: put the essentials at the top (a weather overview + summary, because stakeholders don't read everything); keep the same format from one week to the next to compare at a glance; and choose the visualization according to the message. The Gantt chart, useful for planning, is cumbersome to read and maintain: it is reserved for planning, not weekly reporting.
5 best practices for clear and effective reporting
Choose a suitable sharing frequency
The progress report is by nature a bit intrusive: its frequency is limited to what is necessary to maintain its impact. On a project lasting several months, a report every fortnight is often enough. There is no right frequency in absolute terms: it must be consistent with the chronology of the project. Whatever the frequency, consistency is everything, and automatic reminders help keep up the pace.
Highlighting successes
The report is used to keep the team informed of progress, reporting deviations without making it a red flag. Valuing what has already been achieved maintains momentum. The report offers maximum transparency: the earlier deviations are assumed, the more the team can get involved in correcting them, without masking the difficulties.
Tailor the presentation to the audience
An effective report is delivered to the right people: draw up a list of participants from the preparation of the project, operational as well as managers. The tone, format and volume of information are calibrated according to the audience, because the operational team and sponsors are not addressed in the same way. As a recurring document, the report must remain quick to read and quick to produce.
Use a management tool
Centralizing the project in one tool first solves a reliability problem: a single source of reference, the history of all reports can be consulted, and collaboration (comments, task tracking) in one place. The decisive contribution comes next: with a tool that follows the planned/realized, the report is generated from the time entry and the forecast, and the margin to date remains fair. The consulting firm Altai Consulting (105 employees) has eliminated its Excel consolidations to monitor margin and burn rate in real time. The project manager then analyzes the discrepancies instead of chasing the numbers. To compare solutions, see our overview of the best project monitoring tools.
To manage the progress and margin of your missions, discover project management with Stafiz.
Example: a progress report on a consulting engagement
Here is the framework applied to a concrete case. How to read this report: the Planned column recalls the initial schedule of each phase, Actual gives the status on the date of the report, and Status summarizes the phase with a weather forecast (✅ completed, on track, 🟢 🟡 vigilance, 🔴 alert, ⚪ to come).
Illustrative example (fictitious figures). Mission to redesign the commercial process of a consulting firm: 4 consultants, 250 man-days sold, budget of 300 k€, maturity in 6 months. Week 9 report (of 26).
Global weather: 🟡 Vigilance — the project is moving forward, but consuming faster than it delivers.
| Framing | S1 to S3 | completed S3 | ✅ Completed |
| Analysis | S4 to S8 | ongoing, +1 week | 🟡 +5 days |
| Recommendations | S9 to S18 | started on time | 🟢 On the rails |
| Deployment | S19 to S26 | Not started | ⚪ Coming soon |
Indicators (week 9):
- Physical progress: 40% of deliverables validated.
- Budget progress: 115 man-days consumed out of 250 (46%).
- Estimated margin at completion: down 4 points compared to the forecast.
Interpretation: 40% of deliverables validated for 46% of the budget in days already consumed: we consume faster than we produce, the planned/realized gap widens, and the margin at completion decreases.
Decision triggered: arbitrate the scope of the recommendations phase now, so that a five-day delay in the analysis does not turn into margin drift discovered at closing.
Frequently asked questions:
It is a short and recurring document that takes stock of the status of a project: deliverables achieved, deviations from the planned, risks and next steps. It serves to align the team and, most importantly, to give decision-makers something to judge before a gap becomes a problem.
A project weather, an executive summary, milestones achieved and to come, planned/realized deviations from the schedule and budget, risks with their corrective actions, and an action plan. The main thing is on one page: we go to the information that is useful for the decision.
By a visual synthesis: a weather status (🟢🟡🔴), a forecast/produced table by phase and some key indicators. We adapt the level of detail to the recipient (operational for the team, decision-making for the committee) and we keep the same format from one report to the next.
Physical progress (tasks delivered), budget progress (man-days or budget consumed, which drives the margin at completion) and contractual progress (invoicing milestones). To this is added the rate of resource planning and the Temporal Performance Index to track load deviations.
The internal report, intended for the project team, which goes down to the operational details; and the committee or client report, which is a decision-making summary. The first serves to coordinate, the second to decide; They don't have the same level of detail or transparency about discrepancies.
The rhythm depends on the scope of the project: weekly or bi-monthly internally over a mission of several months, and at each steering committee on the client side. Regularity is paramount: a predictable report is better than an exhaustive but irregular one.
The project manager or the project manager, sometimes supported by the PMO. With a management tool that tracks the planned/achieved, most of the data is generated automatically: the writer focuses on the analysis of the gaps and the decisions to be proposed, not on the collection.