Gantt chart
A Gantt chart is a type of schedule used in project management. It allows you to unravel all the different tasks of a project, their duration, their deadline, their authorized margin of overhang, as well as their interdependence between them.
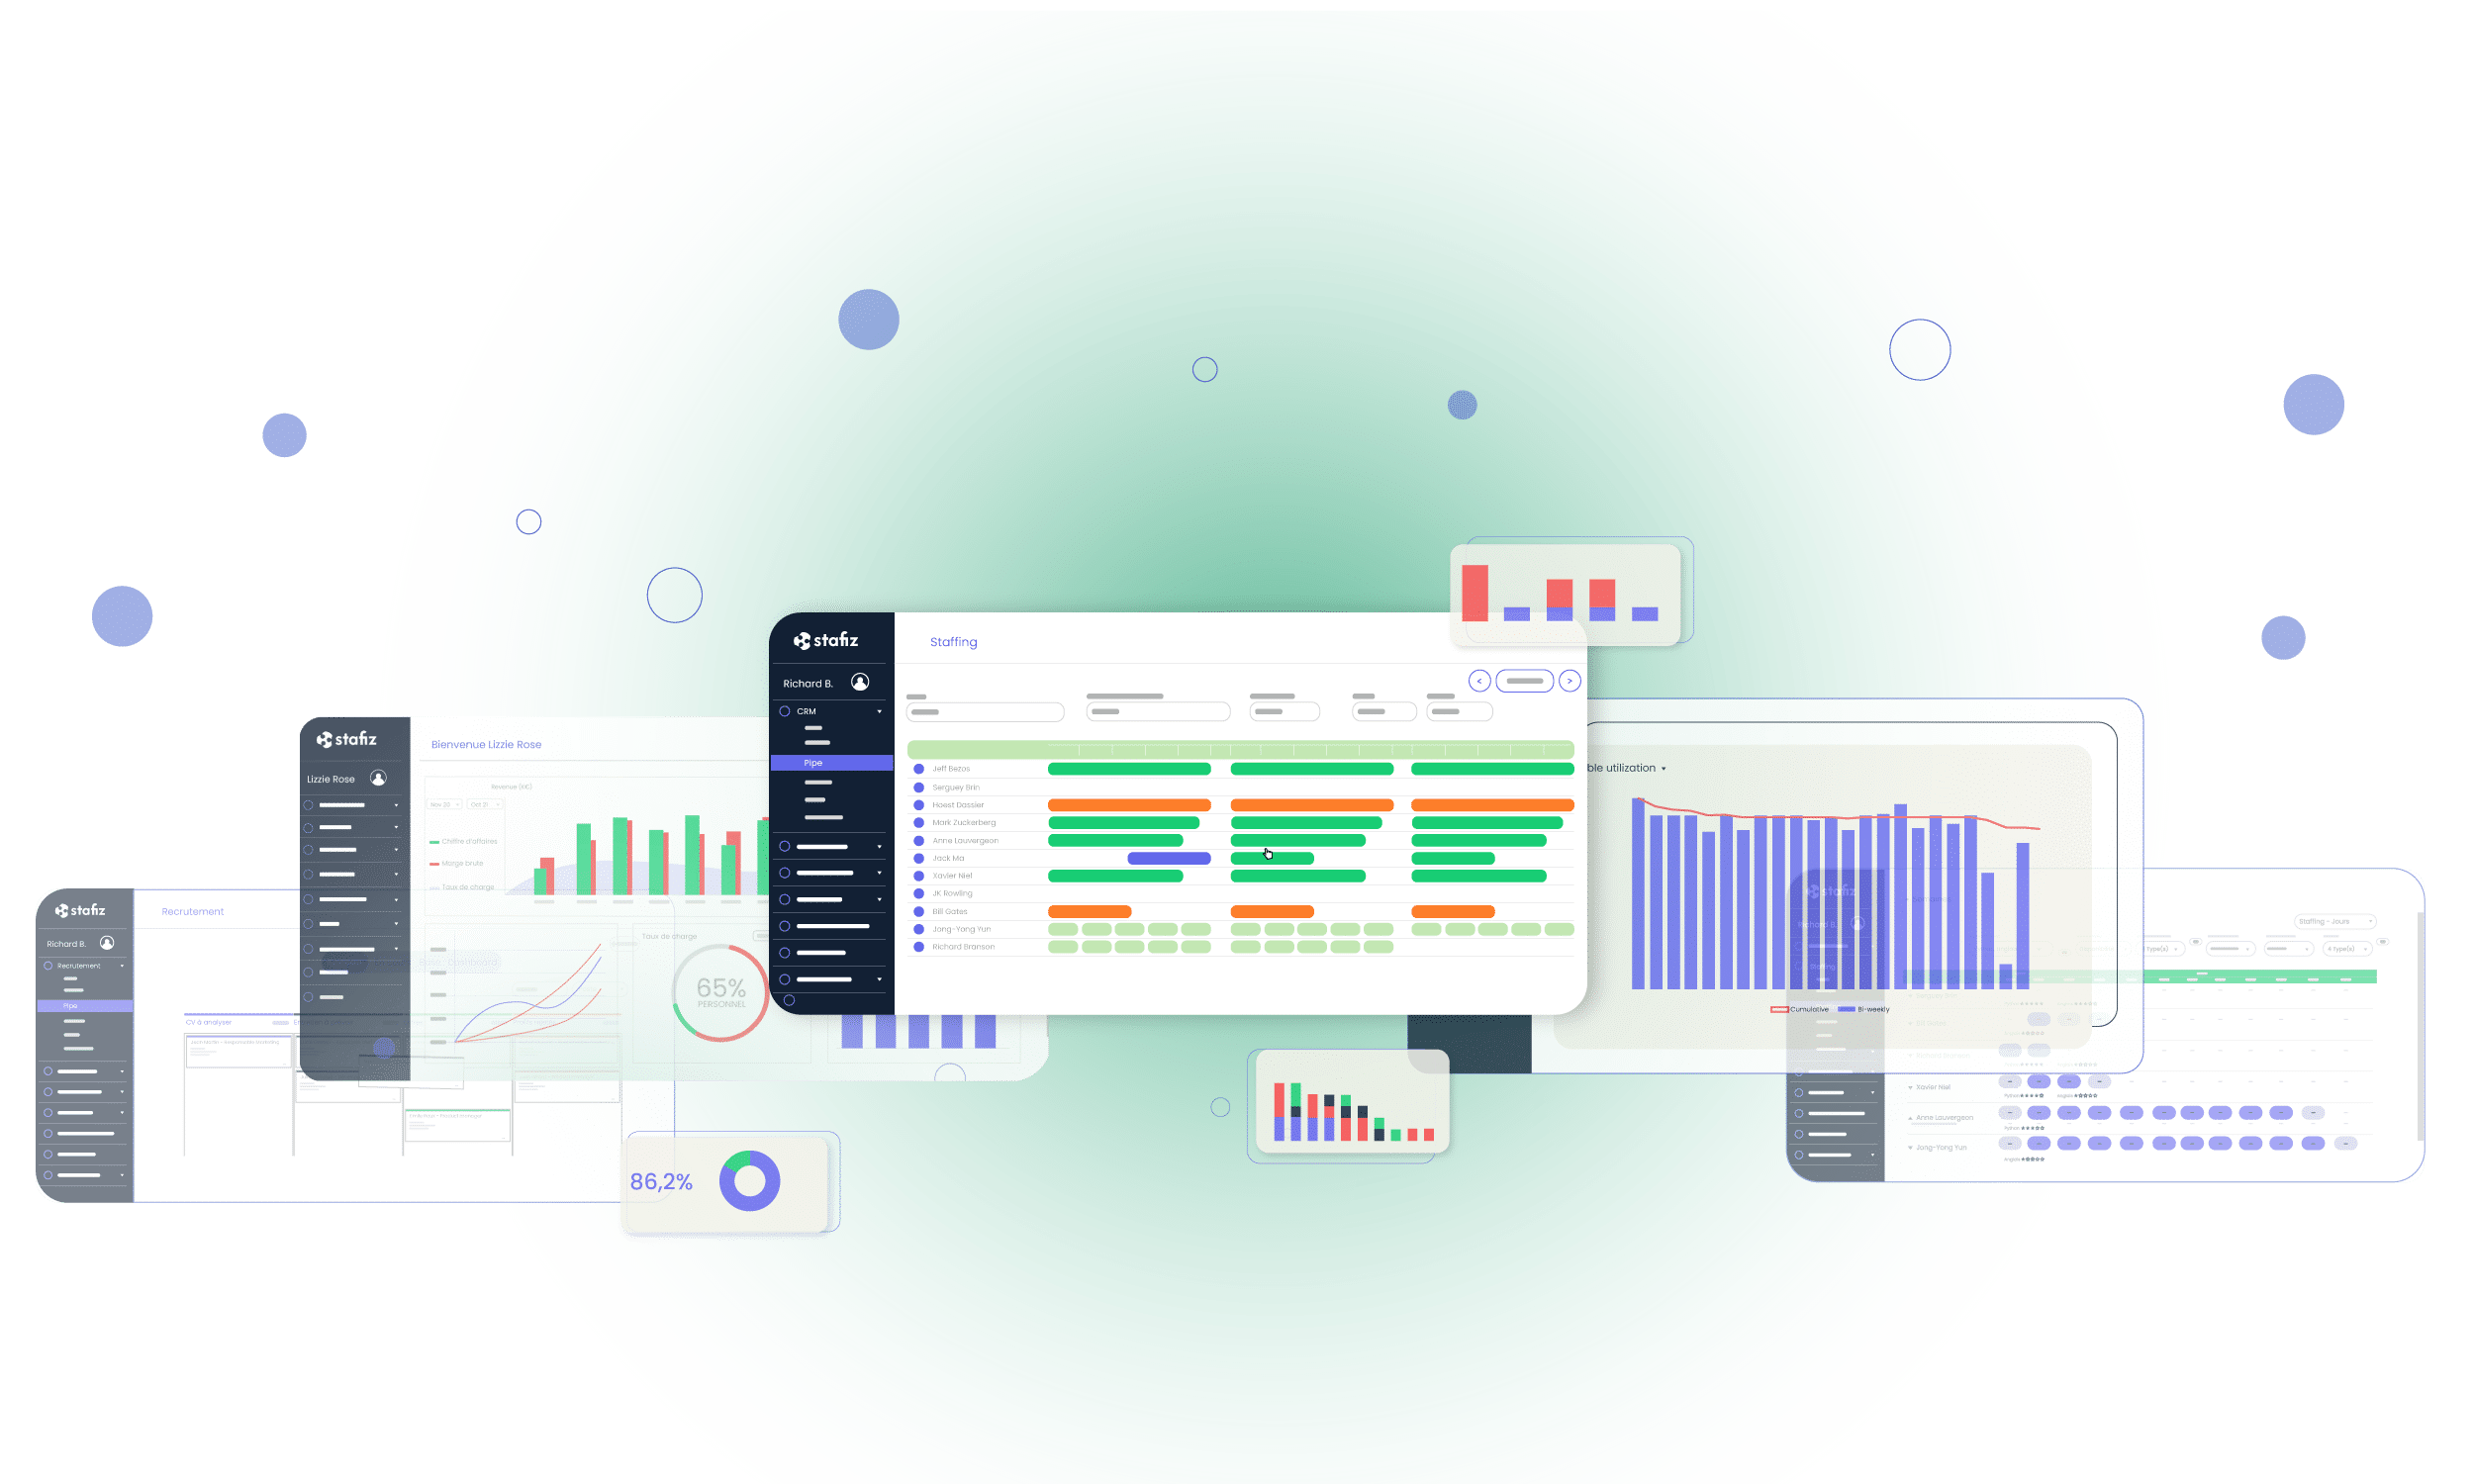
Graphically, it is presented as a frieze. The vertical axis contains the names of tasks or periods, while the vertical axis extends the calendar. Task duration is illustrated by bars, allowing at a quick glance to visualize the tasks where the most effort is concentrated.
The Gantt allows for easy project monitoring thanks to its graphical visibility that allows you to intervene on the management of resources and deadlines.


